Stock Technical Indicators API: MACD & RSI in JSON
Raw OHLCV API or a computed-signals API? Compare both, then call PickSkill's REST API for MACD, RSI and KDJ on US, Hong Kong and A-share stocks.
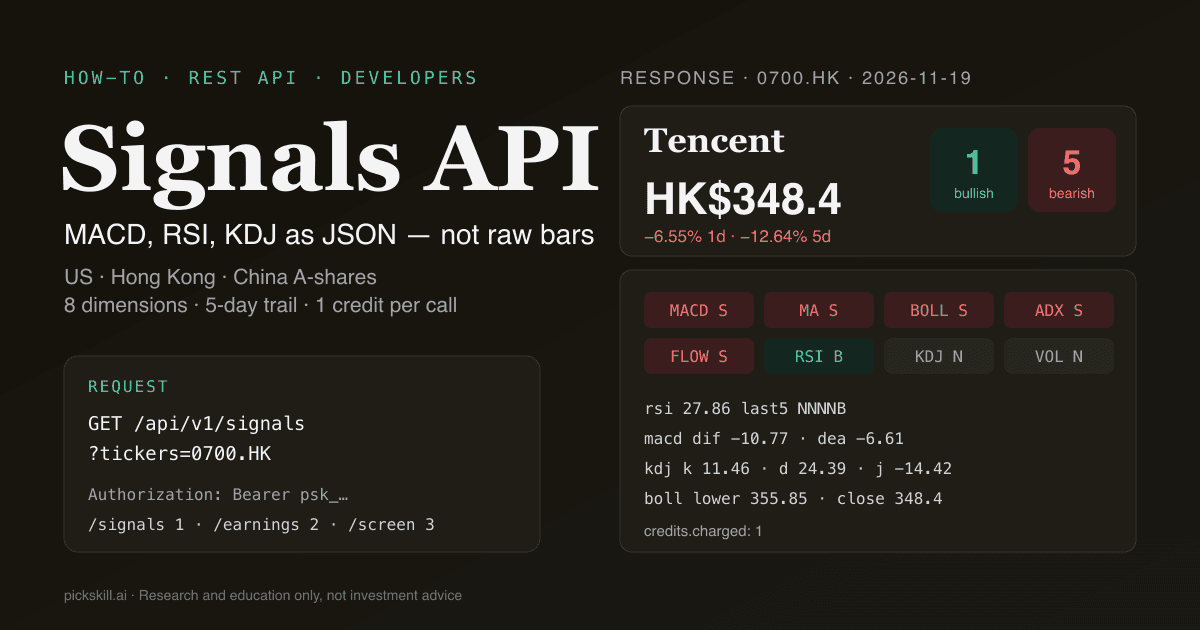
A stock technical indicators API is a web service that returns indicator values such as MACD, RSI or KDJ, and ideally a dated bullish / bearish / neutral reading for each, instead of making you compute them from raw price bars. The real choice is between a raw OHLCV API, where you download prices and run the math yourself, and a computed-signals API, where the reading arrives ready to use. On PickSkill's API, one GET /api/v1/signals call returns eight indicator dimensions for up to 10 tickers for 1 credit; on 19 Nov 2026 it showed Tencent (0700.HK) with RSI(14) at 27.86, five bearish dimensions and one bullish.
This guide compares the three ways developers get technical indicators, then walks through PickSkill's REST API with real requests, real field names and a 15-line Python alert.
Key takeaways
- Raw OHLCV APIs give you prices; signals APIs give you conclusions. With raw bars you own the formulas, the data cleaning and the rules that turn a value into "bullish".
- A-shares need special handling. Main-board stocks move at most 10% a day and STAR Market stocks 20% (SSE); a limit-up bar with high equal to low can fake a trend signal.
- PickSkill's REST API has five endpoints:
/signals,/screen,/earnings,/portfoliosand/credits, authenticated withAuthorization: Bearer <key>. - Pay per call, not per month. 1 credit for signals, 3 for a screen; packs start at 1,000 credits for $10, every account gets 100 free credits, and failed calls are refunded.
- Same data as MCP. The MCP server and the REST API share tools, results and one credit balance.
What is the difference between a raw OHLCV API and a technical signals API?
A raw OHLCV API returns open, high, low, close and volume bars; everything else is your job. To get MACD you request enough history (at least 26 bars for the slow EMA, plus warm-up for the signal line), compute the EMAs, then decide what counts as a crossover and what counts as a signal. A technical signals API does that work on the server and returns the indicator values together with an interpretation and a date. The trade-off is control versus time: raw data lets you tune every parameter and invent your own indicators, while a signals API gives you consistent, already-cleaned readings across markets in one call. Many teams use both: raw bars for backtests, a signals API for alerts and AI agents.
A third option is to skip APIs for indicators entirely and compute them locally with a library such as TA-Lib, which describes itself as offering 200+ indicators under a BSD license with Python wrappers. You still need a reliable price feed to run it on.
How do the three approaches compare?
Third-party data vendor costs vary by plan, so check each vendor's own pricing page.
| Compute yourself (pandas / TA-Lib) | Raw OHLCV data API | Computed signals API (PickSkill) | |
|---|---|---|---|
| What you get | Any indicator you code | Price and volume bars | 8 dimensions: values + bullish/bearish/neutral + 5-day trail |
| Effort to first signal | Highest: data feed, formulas, rules | Medium: formulas and rules | Lowest: one HTTP call |
| Parameter control | Full | Full | Fixed standard settings (e.g. RSI 14, KDJ 9,3,3, Bollinger 20,2) |
| Markets | Whatever your feed covers | Depends on vendor | US, Hong Kong, China A-shares; Japan and Korea tickers accepted |
| A-share limit-up / limit-down bars | You must detect and handle them | You must detect and handle them | High = low bars are forced to neutral |
| Screening a universe | Download and compute every stock | Download and compute every stock | POST /screen over about 950 index members |
| Cost | Library free; price data extra | Vendor subscription or per-call | 1 credit per signals call (from $0.008 to $0.01) |
| Best for | Backtests, custom research | Custom indicators at scale | Alerts, dashboards, AI agents |
For a few standard indicators on a handful of tickers, a signals API ships faster; for backtests with unusual parameters, compute it yourself.
Why do A-shares break naive indicator code?
China A-shares have daily price limits, so some trading days end pinned at the limit with no real price discovery. The Shanghai Stock Exchange sets a 10% daily limit for the main board and 20% for STAR Market stocks after their first five trading days (SSE Q&A). On a one-price limit-up day the bar's high equals its low, which makes range-based indicators such as KDJ, Bollinger and ADX degenerate, and a run of limit days can look like a textbook strong trend to code that never checks for it. Halted stocks produce the same kind of flat bar. PickSkill's indicator engine flags any bar where high equals low and forces that day's reading to neutral in every dimension, including inside the 5-day trail, so a limit run does not fake a signal. If you compute indicators yourself, add the same check before you trust a crossover. For which oscillators A-share traders actually watch, see the best indicators for A-shares.
How do you call PickSkill's technical indicators API?
PickSkill's REST API lives at https://pickskill.ai/api/v1 and needs an API key sent as Authorization: Bearer <key> (an x-api-key header also works). Create the key on your account's API dashboard; every account starts with 100 free credits, and the API and the MCP server draw on the same balance. Successful responses have the shape { data, credits: { charged, remaining } }, and the same numbers arrive in the X-Credits-Charged and X-Credits-Remaining headers. Errors return { error: { code, message, docs } } with status 400, 401, 402 (not enough credits), 403, 404, 405 or 502, and a failed call's credits are refunded. Full parameter tables are in the API docs.
| Endpoint | Method | What it returns | Credits |
|---|---|---|---|
/signals?tickers= | GET | Up to 10 tickers: close, 1-day and 5-day change, 8 dimensions | 1 |
/screen | POST | Stocks matching up to 8 ANDed conditions, with evidence (paid plan required) | 3 |
/earnings?ticker= | GET | Latest EPS vs. estimate plus key ratios | 2 |
/portfolios | GET | Your saved PickSkill portfolios with per-holding signals | 1 |
/credits | GET | Balance, cost per call, credit packs | free |
Here is a real request for Hong Kong, Shanghai and US tickers. Tickers use Yahoo Finance format: 0700.HK, 600519.SS, 300750.SZ, NVDA.
curl "https://pickskill.ai/api/v1/signals?tickers=0700.HK,600519.SS,NVDA" \
  -H "Authorization: Bearer $PICKSKILL_API_KEY"
And the response, trimmed to one stock and four of its eight dimensions. Values are from a live call on 19 Nov 2026 (Hong Kong close of that day):
{
  "data": {
    "disclaimer": "For research and education only; not investment advice. …",
    "legend": "signals[dim].now = latest reading; last5 = last 5 trading days oldest→newest (B bullish, S bearish, N neutral); values = latest indicator values.",
    "stocks": [
      {
        "ticker": "0700.HK",
        "asOf": "2026-11-19",
        "close": 348.4,
        "changePct": -6.55,
        "fiveDayChangePct": -12.64,
        "signals": {
          "macd": { "now": "bearish", "last5": "NNSSS", "values": { "dif": -10.77, "dea": -6.61, "hist": -8.32 } },
          "rsi":  { "now": "bullish", "last5": "NNNNB", "values": { "rsi": 27.86 } },
          "kdj":  { "now": "neutral", "last5": "NNNNN", "values": { "k": 11.46, "d": 24.39, "j": -14.42 } },
          "boll": { "now": "bearish", "last5": "NNNNS", "values": { "mid": 393.32, "upper": 430.79, "lower": 355.85, "bandwidth": 19.05 } },
          "…": "ma, adx, volume, flow"
        },
        "bullishCount": 1,
        "bearishCount": 5,
        "page": "https://pickskill.ai/stocks/0700.HK"
      }
    ]
  },
  "credits": { "charged": 1, "remaining": "…" }
}
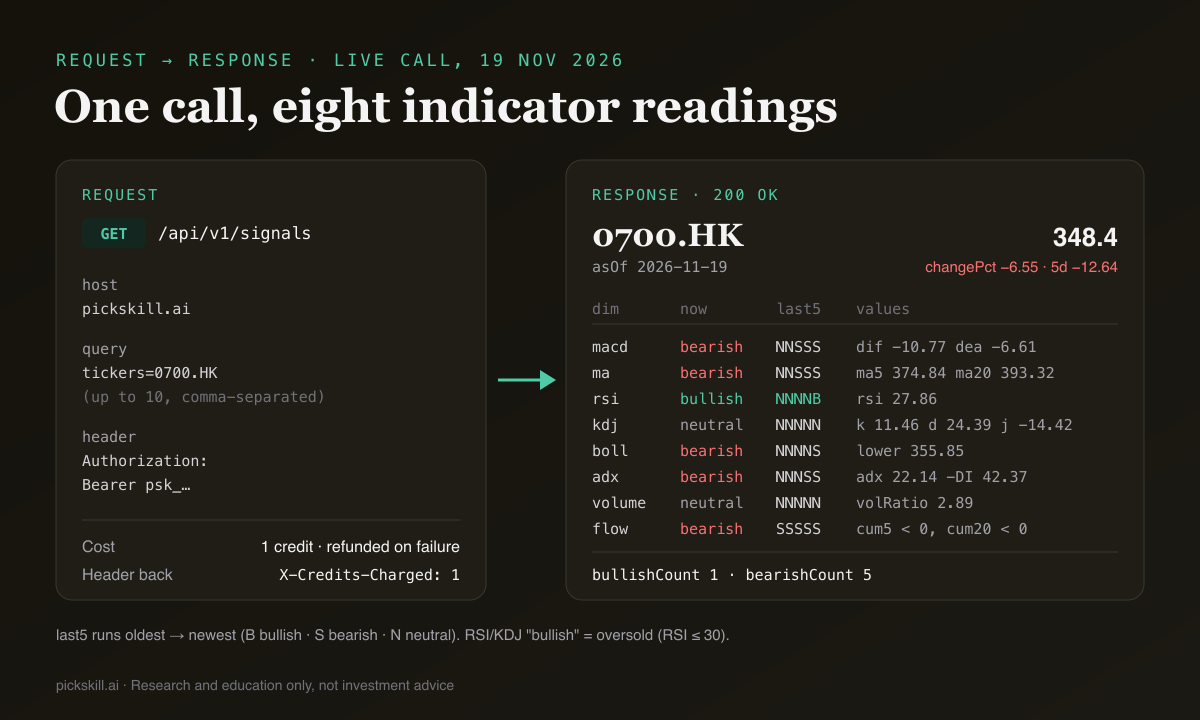
Two details matter when you read it. RSI and KDJ "bullish" means oversold, not "rising": RSI(14) at or below 30 reads bullish and at or above 70 reads bearish. And last5 runs oldest to newest, so NNNNB says the oversold reading appeared on the latest day only. For what each oscillator measures, see what MACD is and what KDJ is.
How do you screen Hong Kong and A-shares through the API?
POST /screen runs conditions across about 950 stocks (S&P 500, Nasdaq-100, Hang Seng and CSI 300 members plus stocks with a PickSkill page) and returns each match with evidence. Conditions come in three types, all ANDed, up to 8 per screen: signal (a dimension held bullish, bearish or neutral for N days), value (for example rsi.rsi < 30 or kdj.j) and event (macd_golden_cross, ma5_ma20_golden_cross, turned_bullish and their opposites, within N days). You can restrict by markets (us, hk, cn) or indices (sp500, ndx, hsi, csi300), sort and return up to 30 matches. A screen costs 3 credits and needs a paid PickSkill plan; Free accounts get a 403 and are not charged. It is the same engine as the signal screener.
curl -X POST "https://pickskill.ai/api/v1/screen" \
  -H "Authorization: Bearer $PICKSKILL_API_KEY" \
  -H "Content-Type: application/json" \
  -d '{"indices":["hsi","csi300"],
       "conditions":[{"type":"value","field":"rsi.rsi","op":"<","value":30}],
       "sort_by":"rsi","limit":8}'
Run against the 19 Nov 2026 close, this screen covered 385 Hang Seng and CSI 300 stocks and matched 33 with RSI(14) below 30. A trimmed match looks like this:
{
  "ticker": "0881.HK",
  "name": "Zhongsheng",
  "market": "hk",
  "indices": ["hsi"],
  "asOf": "2026-11-19",
  "close": 1.73,
  "evidence": ["rsi.rsi = 17.4 (< 30)"]
}
How do you build a signal alert in 15 lines?
A useful first project is an alert that tells you when a reading flips to bullish on your watchlist. Because each dimension comes with a 5-day trail, you don't need to store yesterday's state: a trail ending in NB or SB means the reading turned bullish on the latest day.
- Create an API key on your PickSkill account and export it as
PICKSKILL_API_KEY. - List up to 10 tickers in one call; mixing markets is fine.
- Pick the dimensions you care about, for example MACD, RSI and KDJ.
- Check the last two characters of each
last5trail. - Schedule the script once a day after the close (cron, GitHub Actions or a cloud function). One run costs 1 credit.
import os, requests

URL = "https://pickskill.ai/api/v1/signals"
KEY = os.environ["PICKSKILL_API_KEY"]
WATCH = "NVDA,0700.HK,600519.SS"

r = requests.get(URL, params={"tickers": WATCH},
                 headers={"Authorization": f"Bearer {KEY}"}, timeout=30)
r.raise_for_status()
body = r.json()
for s in body["data"]["stocks"]:
    for dim in ("macd", "rsi", "kdj"):
        trail = s.get("signals", {}).get(dim, {}).get("last5", "")
        if trail[-2:] in ("NB", "SB"):
            print(f"{s['ticker']} {dim} turned bullish ({trail}) as of {s['asOf']}")
print("credits left:", body["credits"]["remaining"])
With the data from 19 Nov 2026 the script prints one line, 0700.HK rsi turned bullish (NNNNB) as of 2026-11-19: Tencent's RSI dropped into oversold territory that day. NVDA's RSI had read bullish all five days (BBBBB), so it is not a fresh flip, and Kweichow Moutai (600519.SS) had no new bullish reading.
How much does the API cost?
API usage is billed in prepaid credits, separately from the chat plans on the pricing page. Every account gets 100 free credits once; after that, packs are 1,000 credits for $10, 5,000 for $45 and 20,000 for $160, and credits never expire. At those prices a 10-ticker signals call costs between $0.008 and $0.01, so the daily alert above runs for well under a cent a day. There is no fixed rate quota; calls are limited by your balance. Details and the live pack list are on the Data API page.
If you would rather let an AI agent make these calls, the same tools are available over MCP; our roundup of MCP servers for stock market data compares the options.
Research and education only, not investment advice. Technical signals describe past price action and do not predict returns.
FAQ
Is there a free stock technical indicators API? PickSkill gives every account 100 free API credits once, which covers 100 signals calls of up to 10 tickers each. After that you buy prepaid packs starting at 1,000 credits for $10. Computing indicators yourself with open-source libraries such as TA-Lib is free, but you still need a price data source to feed them.
Which API returns MACD and RSI for Hong Kong and China A-shares?
PickSkill's /api/v1/signals endpoint returns MACD, RSI, KDJ, moving averages, Bollinger Bands, ADX, volume and money flow for Hong Kong tickers such as 0700.HK and A-shares such as 600519.SS or 300750.SZ, along with US stocks. Each dimension includes the latest values, a bullish, bearish or neutral reading and a 5-day trail.
How does the API handle A-share limit-up days? Any daily bar whose high equals its low, which is what a one-price limit-up, limit-down or trading halt produces, is treated as no information. That day's reading is forced to neutral in every indicator dimension, including inside the 5-day trail, so a run of limit days cannot create a false strong-trend signal.
What is the difference between the REST API and the MCP server? They run the same tools, return the same data and share one credit balance. The REST API suits your own scripts, dashboards and backends; the MCP server suits AI agents such as Claude Code, Cursor or Claude Desktop, which discover the tools and call them on their own.
Can I change indicator parameters like the RSI period? No. The API returns standard settings: RSI(14), KDJ(9,3,3), Bollinger(20,2), ADX/DMI(14) and moving averages of 5, 20 and 60 days, among others. If your strategy depends on custom periods, pull raw prices and compute those indicators yourself, and use the signals API for quick checks and alerts.