DCF vs Reverse DCF: What Growth Is Priced In?
DCF vs reverse DCF explained: the steps, a Python solver and a real Apple example showing the 13.1% 10-year FCF growth priced in at $352.45 (18 Nov 2026).
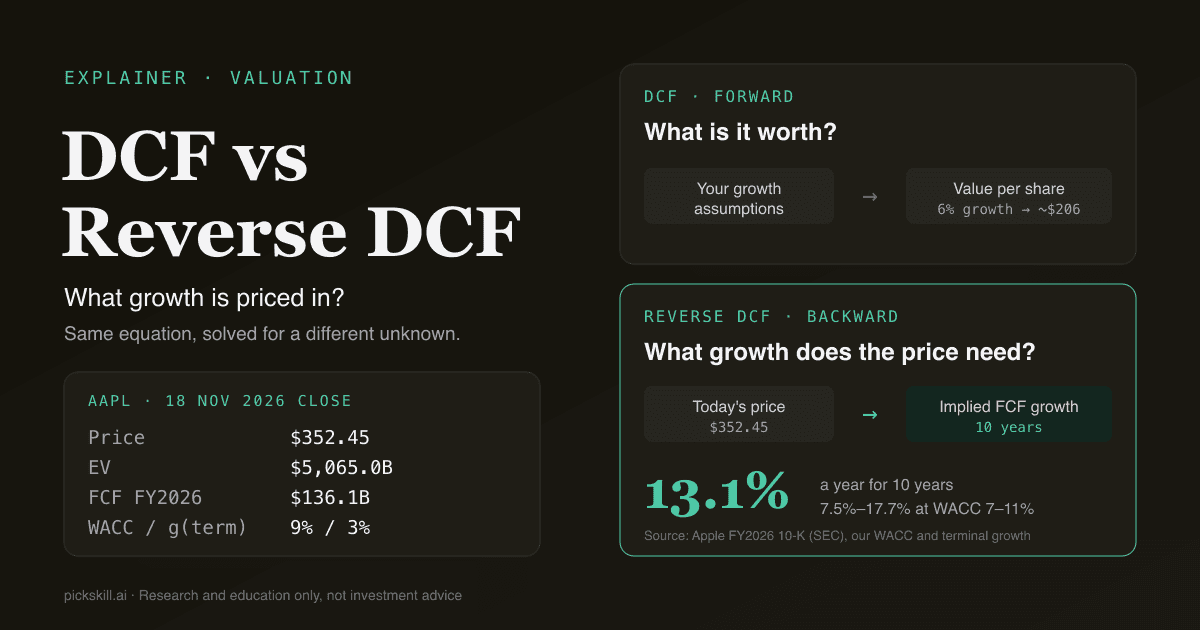
A DCF starts from your growth assumptions and solves for what a company is worth; a reverse DCF starts from today's share price and solves for the growth the market must be assuming. A reverse DCF is the same discounted cash flow equation run backwards: price, cash flow, discount rate and terminal growth go in, and the implied growth rate comes out. Apple at $352.45 (18 Nov 2026 close) prices in about 13.1% a year of free-cash-flow growth for ten years, by our calculation from its FY2026 10-K at a 9% WACC and 3% terminal growth.
Both methods use identical math; what changes is which number you have to guess.
Key takeaways
- DCF: assumptions → value. Reverse DCF: price → implied assumptions. Same formula, different unknown.
- A reverse DCF removes the hardest guess (ten years of growth) and replaces it with a judgement: is the implied rate achievable?
- You still choose a WACC and a terminal growth rate, and the answer moves a lot with them. Always show a sensitivity table.
- Apple (18 Nov 2026): a $5.07T enterprise value on $136.1B of FCF implies 13.1% annual FCF growth at a 9% WACC, and 7.5% to 17.7% for WACC between 7% and 11%.
- The solver is about ten lines of Python: a bisection that finds the growth rate at which the DCF equals today's enterprise value.
What is the difference between DCF and reverse DCF?
The difference between a DCF and a reverse DCF is the direction of the calculation. A forward DCF takes your forecasts of free cash flow, discounts them at the cost of capital, adds a terminal value and outputs an intrinsic value per share to compare with the price. A reverse DCF fixes the output instead: it sets the model's enterprise value equal to the market's and solves for the one input left open, usually free-cash-flow growth and sometimes the operating margin. The result is a statement about expectations rather than value ("to justify $352.45, Apple's FCF has to compound at roughly 13% a year for a decade"), and judging whether that is too high or too low is far easier than writing a precise ten-year forecast.
| DCF (forward) | Reverse DCF | |
|---|---|---|
| Question it answers | What is the stock worth? | What growth is priced in? |
| Inputs you supply | Growth, margins, WACC, terminal growth | Price, shares, net debt, FCF, WACC, terminal growth |
| Output | Intrinsic value per share | Implied FCF growth (or margin) |
| Hardest assumption | Ten years of growth | None on growth; you judge the result |
| Typical failure | Optimistic growth inflates value | A wrong WACC shifts the implied rate |
| Best used for | Building a full thesis | Sanity-checking the market's expectations |
If you are new to the forward version, start with What is DCF?, which walks through each line of the model.
How does a regular DCF work?
A regular DCF projects free cash flow for 5 to 10 years, discounts each year at the weighted average cost of capital, and adds a terminal value for everything after the forecast; the sum is enterprise value. Subtract net debt and divide by shares to get value per share. With Apple's numbers below, a 9% WACC and 3% terminal growth, assuming 6% annual FCF growth gives about $206 per share and 8% gives about $240. Neither is near the $352.45 price, and nothing inside the forward model tells you which growth rate is reasonable — the gap a reverse DCF fills.
Free cash flow here is operating cash flow minus capital expenditure; see What is free cash flow? for the variations.
What is a reverse DCF?
A reverse DCF is a discounted cash flow model solved backwards for the growth rate that makes the model's value equal the current market value. Michael Mauboussin and Alfred Rappaport built a whole method on this in Expectations Investing: the price already contains a forecast, and the analyst's job is to read it. You keep everything from the forward DCF (starting free cash flow, forecast length, WACC, terminal growth), leave one input open, and let a solver find the value that matches the enterprise value implied by the share price.
Free-cash-flow growth is the usual unknown; for companies not yet profitable, analysts solve for the long-run operating margin instead.
Why does a reverse DCF reduce assumption risk?
A reverse DCF reduces assumption risk because it takes the input you are worst at estimating and turns it into the output. Nobody can forecast a decade of growth to within a percentage point, yet a forward DCF demands exactly that and then reports a precise-looking value. In the reverse version the question becomes "is 13% growth for ten years plausible?", which you can test against history, peers and guidance without claiming to know the exact number.
The risk does not vanish: the discount rate and terminal growth still drive the answer, so every reverse DCF needs a sensitivity table.
How do you run a reverse DCF step by step?
You run a reverse DCF in seven steps: collect the market inputs, compute enterprise value, pick the starting cash flow, set the discount rate and terminal growth, write the DCF as a function of growth, solve for the growth that matches enterprise value, and stress-test the answer.
- Get the price and share count. Use the latest close and the share count on the cover of the most recent 10-K or 10-Q.
- Compute enterprise value. Market cap plus debt minus cash and marketable securities. A net-cash company has an EV below its market cap.
- Choose the starting free cash flow. Operating cash flow minus capital expenditure for the latest fiscal year or trailing twelve months.
- Set WACC and terminal growth. Write them down explicitly; see What is WACC? for how to build the discount rate.
- Write the DCF as a function of growth. Grow FCF at rate g for ten years, add a Gordon terminal value, and discount everything.
- Solve for g. Find the growth rate where the model's EV equals the market EV, with Excel's Goal Seek or a numeric solver.
- Run the sensitivity grid. Recompute implied growth across a range of WACC and terminal growth, then compare the range with history.
Reverse DCF example: what growth is priced into Apple?
We used Apple because its free cash flow is large and positive, which a reverse DCF needs. Company figures come from Apple's FY2026 Form 10-K, filed with the SEC on 3 Nov 2026 for the year ended 26 Sep 2026; the price is the 18 Nov 2026 close from Yahoo Finance. For WACC we used 9%: the 10-year Treasury yield was 5.10% on 17 Nov 2026 (FRED, DGS10), plus roughly 4 points of equity risk premium for a beta near 1, and with little net debt Apple's WACC is close to its cost of equity. Terminal growth is 3%; both are our assumptions, not Apple's.
| Input | Value | Source |
|---|---|---|
| Share price | $352.45 | 18 Nov 2026 close |
| Shares outstanding | 14,532,182,000 | 10-K cover, as of 23 Oct 2026 |
| Market cap | $5,121.9B | price × shares |
| Cash + marketable securities | $136.9B | 36.3 + 20.4 + 80.2 (balance sheet) |
| Commercial paper + term debt | $80.1B | 2.0 + 9.9 + 68.2 |
| Enterprise value | $5,065.0B | market cap − $56.8B net cash |
| Operating cash flow FY2026 | $145.1B | cash flow statement |
| Capital expenditure FY2026 | $9.0B | payments for PP&E |
| Free cash flow FY2026 | $136.1B | 145.1 − 9.0 |
| WACC / terminal growth | 9% / 3% | our assumptions |
The solver grows FCF for ten years, adds a terminal value, and bisects on g until the model's EV matches $5,065.0B. Year 1 is fiscal 2027 and cash flows are discounted in whole years, a simplification that is fine here.
fcf0, ev = 136.056e9, 5065.0e9          # FY2026 FCF, enterprise value

def dcf(g, wacc=0.09, gt=0.03, years=10):
    pv, f = 0.0, fcf0
    for t in range(1, years + 1):
        f *= 1 + g
        pv += f / (1 + wacc) ** t
    tv = f * (1 + gt) / (wacc - gt)
    return pv + tv / (1 + wacc) ** years

lo, hi = -0.5, 1.0                       # bisection on g
for _ in range(100):
    mid = (lo + hi) / 2
    lo, hi = (mid, hi) if dcf(mid) < ev else (lo, mid)
print(f"implied growth: {mid:.2%}")      # implied growth: 13.13%
The answer is 13.1% a year. At that rate free cash flow reaches about $467B in year ten, 3.4 times today's level, and the terminal value still makes up 67% of enterprise value. For context, Apple's FCF grew from $108.8B in FY2024 to $136.1B in FY2026, an 11.8% compound rate, while revenue rose 15.1% in FY2026 alone.
Two caveats. FY2026's 38% FCF jump from $98.8B partly reflects a weak FY2025, when working capital absorbed $25.0B versus $14.9B in FY2026, so the two-year rate is the fairer yardstick. And this FCF adds back $13.8B of stock-based compensation; treating it as a cash cost raises the implied growth to 14.5%.
How sensitive is the implied growth to WACC?
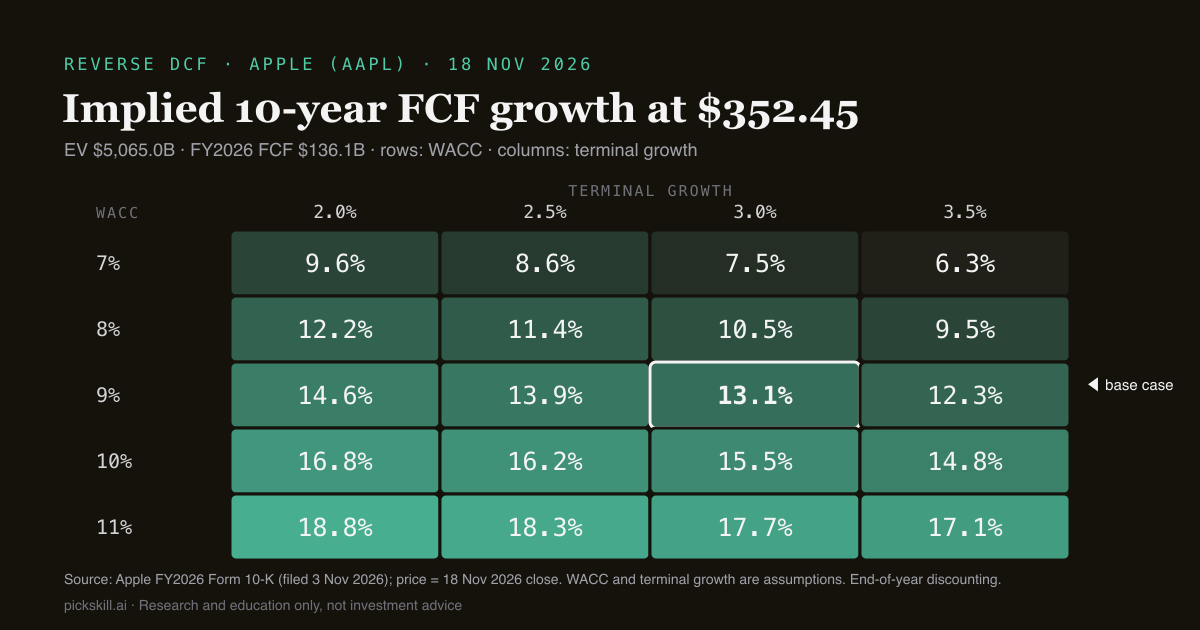
Very sensitive: each 1-point change in WACC moves Apple's implied 10-year FCF growth by about 2 to 3 points. At a 7% WACC and 3% terminal growth the price needs only 7.5% annual growth; at 11% it needs 17.7%. Terminal growth matters less, shifting the answer by up to about 1.2 points per half-point step. So the useful output is the range, and the real question is whether the company can plausibly clear its low end.
| WACC \ terminal growth | 2.0% | 2.5% | 3.0% | 3.5% |
|---|---|---|---|---|
| 7% | 9.6% | 8.6% | 7.5% | 6.3% |
| 8% | 12.2% | 11.4% | 10.5% | 9.5% |
| 9% | 14.6% | 13.9% | 13.1% | 12.3% |
| 10% | 16.8% | 16.2% | 15.5% | 14.8% |
| 11% | 18.8% | 18.3% | 17.7% | 17.1% |
The grid holds price, FCF and net debt fixed. Read it as a map of expectations, not a verdict: where you sit on it is a judgement about risk.
What are the limits of a reverse DCF?
A reverse DCF tells you what the market expects, not whether the market is right, and it shares every input weakness of a forward DCF. The starting cash flow can be distorted by one strong or weak year, so many analysts use a two- or three-year average. A single constant growth rate is also a simplification: real companies grow fast and then slow down, and a two-stage model can paint a different picture.
The method breaks down when free cash flow is negative or tiny, because no growth rate on a near-zero base gives a sensible answer; solve for margin or revenue growth instead. Buybacks matter too. Apple's share count fell from 14.77B to 14.53B during FY2026, so per-share growth can outpace total FCF growth.
How can you run a reverse DCF with PickSkill?
You can run one in PickSkill's AI analyst chat by asking in plain language, for example: "Run a reverse DCF on AAPL from the latest 10-K. Use 9% WACC and 3% terminal growth, solve for implied 10-year FCF growth, and show a WACC × terminal growth sensitivity table." The analyst pulls the filing figures, shows each input with its source, and can export the model to Excel so you can change any cell. The workflow is the one in How to build a DCF in 60 seconds.
If you prefer to build it yourself, start from our DCF model Excel template and use Goal Seek to find the growth input that sets value per share equal to the price. Either way, check the inputs against the filing before trusting the output.
FAQ
What does a reverse DCF tell you? A reverse DCF tells you the growth rate, or sometimes the margin, that today's share price implies once you fix a discount rate and terminal growth. It turns the price into an explicit expectation you can test against history, peers and guidance. It does not say whether the stock is cheap or expensive; that depends on whether you think the implied growth is achievable.
Is a reverse DCF better than a DCF? Neither is better; they answer different questions. A forward DCF is what you need for your own value estimate and a full thesis. A reverse DCF is faster and less exposed to optimistic growth assumptions, so it works well as a first check. Many analysts run it first and build a full forward DCF only when the implied expectations look clearly too high or too low.
How do you calculate implied growth in a reverse DCF? Compute enterprise value from the share price, share count and net debt. Write a DCF in which free cash flow grows at rate g for ten years plus a terminal value, discounted at WACC. Then solve for the g that makes the DCF equal enterprise value, using Excel's Goal Seek or a bisection search. For Apple at $352.45, the result is 13.1% at a 9% WACC.
What WACC should I use in a reverse DCF? Use the same WACC you would use in a forward DCF: the cost of equity (risk-free rate plus an equity risk premium scaled by beta) blended with the after-tax cost of debt. Because the result is very sensitive to it, show a range. In our Apple example, moving WACC from 8% to 10% moves implied growth from 10.5% to 15.5%.
Can you do a reverse DCF with negative free cash flow? Not on free-cash-flow growth, because compounding a negative or near-zero base gives meaningless results. Solve for a different variable instead, such as the long-run operating margin or the revenue growth needed to reach a target margin. That version answers the same question: what does the price require the business to become?
Data as of 18 Nov 2026. Company figures from Apple's FY2026 Form 10-K; WACC and terminal growth are our assumptions. Research and education only, not investment advice.