Dot-Com Bubble vs AI Boom: Valuations Then and Now
Nasdaq 2000 vs today: forward and trailing P/E, Shiller CAPE, top-10 concentration, earnings growth and capex, with every figure dated and sourced.

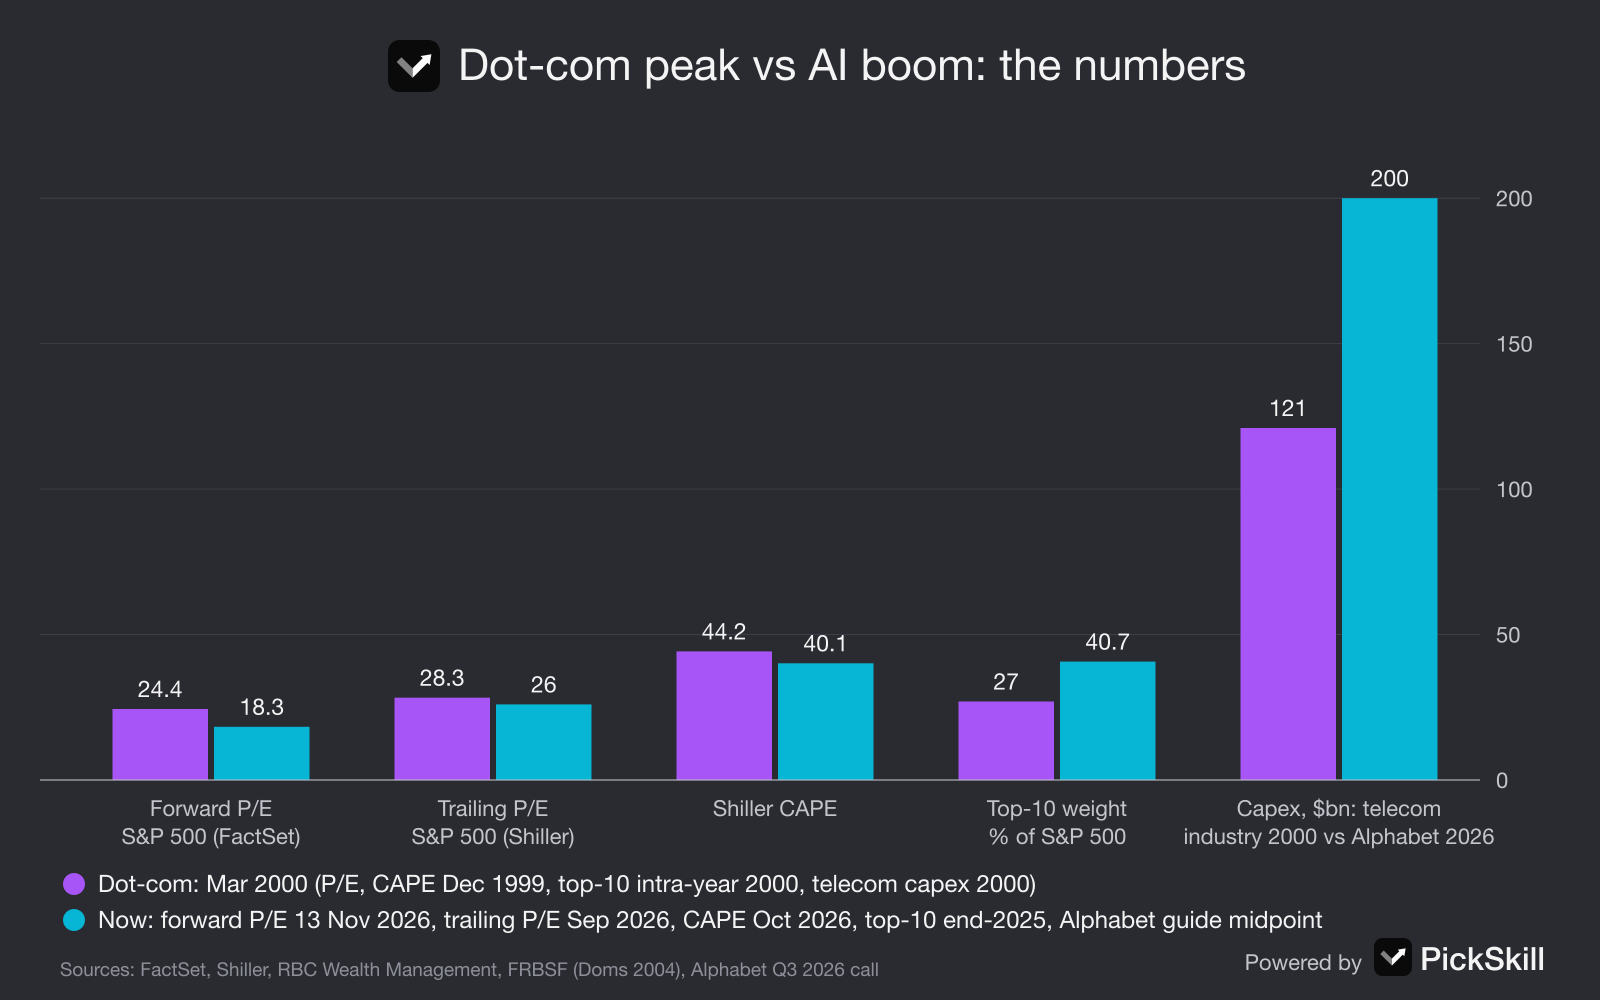
On most valuation measures the AI boom is expensive but still below dot-com extremes; on concentration and spending it has gone further. The dot-com bubble was the late-1990s surge in internet and telecom stocks that peaked on 10 March 2000 and cost the Nasdaq Composite 78%. At that peak the S&P 500 traded at 24.4 times forward earnings; on 13 November 2026 it traded at 18.3 (FactSet). The Shiller CAPE was 40.1 in October 2026, against a 44.2 record in December 1999.
Two things are more extreme today: the ten largest stocks made up 40.7% of the S&P 500 at the end of 2025, against about 27% at the 2000 peak, and a single company, Alphabet, plans more capital spending in 2026 than the entire US telecom services industry spent in 2000. Every figure below is dated and linked to its source.
Key takeaways
- Forward P/E: lower now. S&P 500 24.4 on 24 March 2000 vs 18.3 on 13 November 2026, as analysts expect 33.3% earnings growth for 2026 (FactSet).
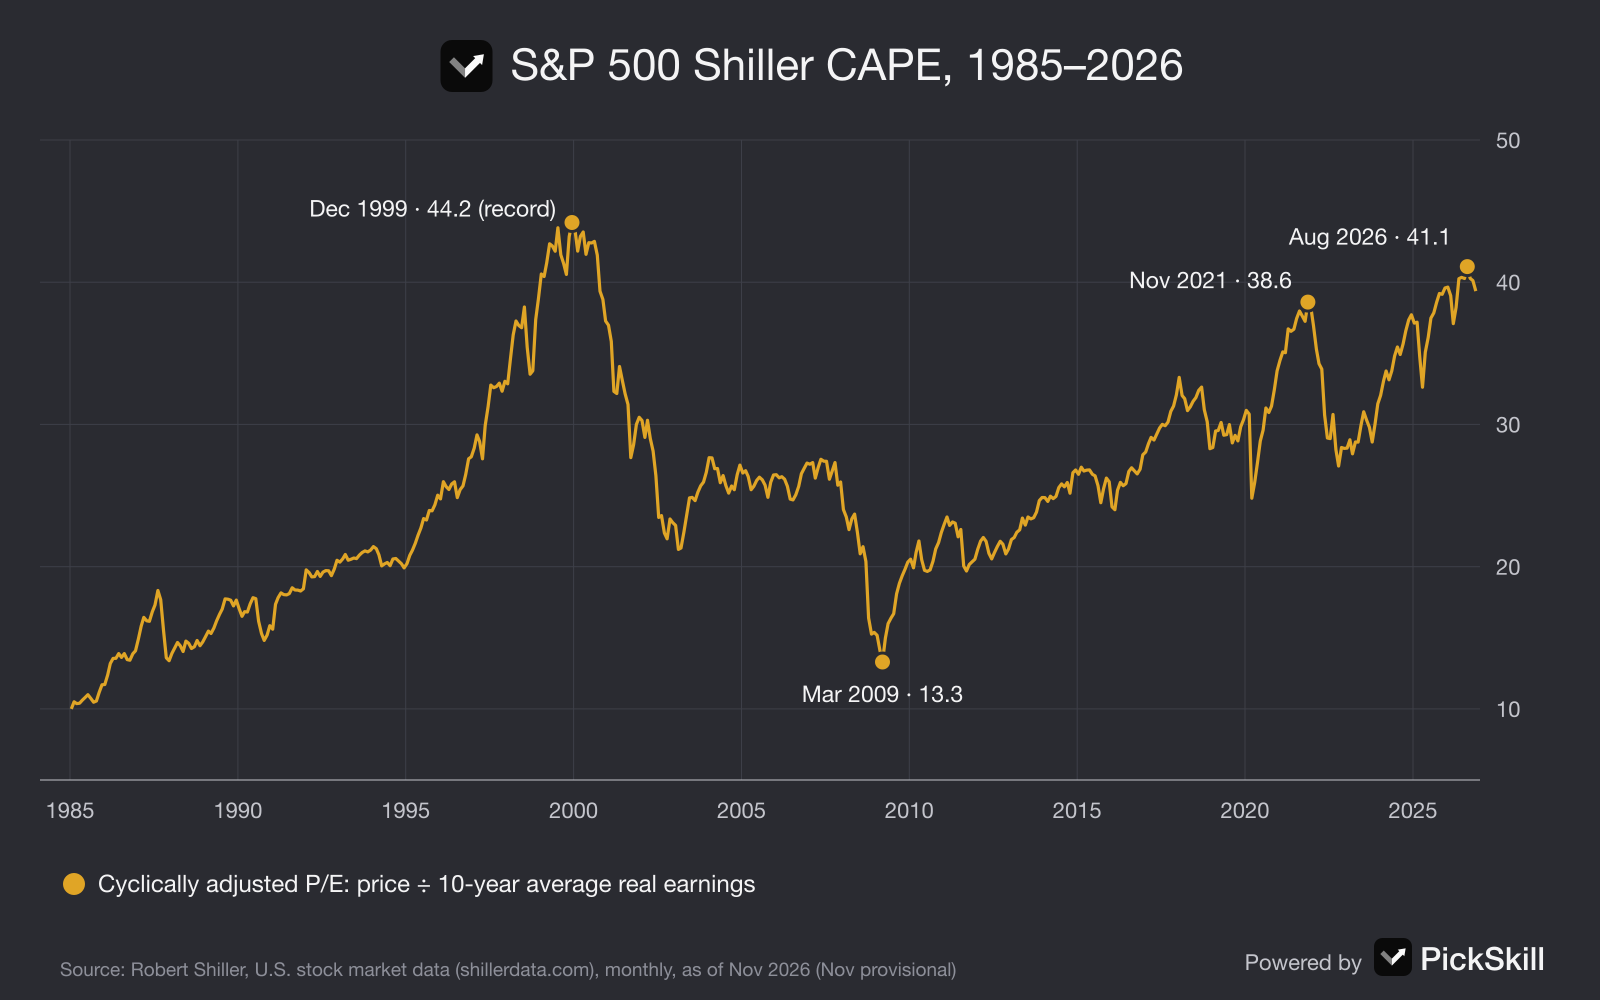
- CAPE: close to the record. 44.2 in December 1999 vs 40.1 in October 2026, per Robert Shiller's data.
- Concentration: higher now. Top-10 weight about 27% in 2000 vs 40.7% at end-2025 (RBC Wealth Management).
- Earnings growth: strong in both. S&P 500 trailing earnings were up 32.8% a year in March 2000; Q3 2026 earnings grew 31.9%, Information Technology 69.4%.
- Capex: bigger now. Telecom carriers spent $121 billion in 2000; Alphabet alone guides to $195–205 billion for 2026.
How do dot-com and AI-boom valuations compare?
The short answer is that prices relative to expected profits are lower today, while prices relative to past profits are almost as stretched. The forward P/E, price divided by the next twelve months of expected earnings, peaked at 24.4 for the S&P 500 on 24 March 2000, according to FactSet; its 13 November 2026 Earnings Insight puts it at 18.3, below the 10-year average of 19.1. Measures based on reported earnings tell a closer story: a trailing P/E of 28.3 in March 2000 versus 26.0 in September 2026 in Robert Shiller's data. If you are new to these ratios, our guide to the P/E ratio explains forward and trailing versions.
| Measure | Dot-com peak | AI boom, latest | Source |
|---|---|---|---|
| S&P 500 forward 12-month P/E | 24.4 (24 Mar 2000) | 18.3 (13 Nov 2026) | FactSet |
| S&P 500 trailing P/E, reported earnings | 28.3 (Mar 2000) | 26.0 (Sep 2026) | Shiller |
| S&P 500 Shiller CAPE | 44.2 (Dec 1999), 43.2 (Mar 2000) | 40.1 (Oct 2026) | Shiller |
| Nasdaq-100 trailing / forward P/E | no comparable series found | 32.8 / 21.2 (31 Oct 2026) | Siblis Research |
| Top-10 stocks, % of S&P 500 | about 27% (2000 intra-year peak) | 40.7% (31 Dec 2025) | RBC Wealth Management, FactSet |
| S&P 500 trailing earnings growth | +32.8% (Mar 2000, y/y) | +25.6% (Sep 2026, y/y) | Shiller |
| 10-year Treasury yield | 6.26% (Mar 2000 average) | 5.10% (17 Nov 2026) | Shiller; FRED via PickSkill |
| Biggest capex wave | Telecom services $121bn (2000) | Alphabet $195–205bn guide (2026) | FRBSF; Alphabet |
Is the stock market more concentrated than in 2000?
Yes, by a wide margin. According to RBC Wealth Management, using FactSet data as of 31 December 2025, the ten largest S&P 500 companies made up 40.7% of the index's market capitalization, a record, against about 27% at the 2000 intra-year peak and about 23% at the end of 2000. The same note estimated that those ten companies would earn about 32% of the index's 2025 profits, so their weight is roughly a third larger than their share of earnings. That gap is smaller than the gap in 2000, when many of the largest stocks were priced on revenue that had not yet turned into profit, but the absolute concentration is higher. In practice it means an S&P 500 index fund is now a large bet on a handful of AI-linked companies.
Is the Shiller CAPE a good bubble signal?
It is a good signal of expensiveness and a poor timing tool. The CAPE divides the price by ten years of inflation-adjusted average earnings, which smooths out booms and recessions. In Shiller's monthly data it first rose above 40 in January 1999 and stayed there until September 2000: an investor who sold on the signal was 14 months early, but then avoided a 49% fall in the S&P 500. In 2026 the CAPE has been above 40 every month from May to October, peaking at 41.1 in August. One caveat cuts the other way from 2021: the 10-year Treasury yield was 5.10% on 17 November 2026, against 1.56% in November 2021, so bonds now compete harder with expensive stocks.
Are AI leaders' earnings stronger than dot-com leaders' were?
Today's leaders earn more, but strong earnings also preceded the 2000 top. In FactSet's 13 November 2026 report, S&P 500 earnings grew 31.9% in Q3 2026 and Information Technology 69.4%, with semiconductors up 133%; analysts expect 33.3% growth for 2026 and 16.2% for 2027. Yet Shiller's data show S&P 500 trailing earnings up 32.8% year on year in March 2000 too. The problem then was what came next: S&P 500 reported earnings fell 54%, from $53.70 a share in September 2000 to $24.69 in December 2001, as the telecom build-out stopped. Cisco is the cautionary tale. It became the world's most valuable company on 27 March 2000 at about $569 billion, according to Cisco's own history site, then fell more than 85% and was still below its 2000 closing high 25 years later, Business Insider reported in November 2025. A great business at a bubble price can still be a poor investment for a long time.
Is AI spending bigger than the dot-com telecom build-out?
In dollars, yes. In a 2004 San Francisco Fed study, Mark Doms found that capital spending by publicly traded US telecom service companies rose from $47 billion in 1995 to a peak of $121 billion in 2000, then fell by more than half to $49 billion in 2002. Total US investment in IT goods reached $401.6 billion in 2000. Today, Alphabet alone spent $51.4 billion on capex in Q3 2026 and kept its 2026 guidance at $195–205 billion, telling investors on its Q3 2026 call to expect a significant increase in 2027. About 65% of that infrastructure spend went on servers and networking with roughly six-year useful lives. These are nominal figures and the economy is larger, so the comparison flatters the present scale somewhat, but the direction is clear.
The difference from 2000 is who pays. The telecom build-out ended in the bankruptcies of WorldCom, Global Crossing and many smaller carriers. Alphabet covered about four-fifths of its Q3 2026 capex from $42.3 billion of operating cash flow, but its free cash flow was still negative $9.1 billion and its long-term debt stood at $125.1 billion.
What does the comparison mean for investors?
Valuation comparisons tell you how much optimism is in the price, not when it will leave. Four lessons from the dot-com cycle stand out:
- Expensive can stay expensive. The CAPE sat above 40 for 21 months before and after the 2000 peak.
- Earnings growth is not protection by itself. S&P 500 earnings were growing more than 30% a year in March 2000.
- Concentration cuts both ways. When the leaders fell in 2000–02, the Nasdaq dropped 78% while the S&P 500 fell 49%.
- Watch the financing. Capex that outruns cash flow and turns to debt was the link between the 2000 boom and the bust.
To see what came after the dot-com peak for stocks, gold, cash and homes, open the dot-com bust on PickSkill's crisis cycles page. Our companion piece asks whether the AI bubble is about to burst using the live crisis signal board, and you can check the Nasdaq-100 constituents' daily signals, or ask PickSkill's AI analyst how concentrated your own holdings are.
This article is for research and education only, not investment advice.
FAQ
Is AI like the dot-com bubble? In some ways. Both are technology booms with heavy spending and a concentrated market. The S&P 500 Shiller CAPE was 40.1 in October 2026, close to the 44.2 record of December 1999. But the forward P/E is lower, 18.3 in November 2026 against 24.4 in March 2000, because today's leaders earn much more.
What was the Nasdaq P/E in 2000? We could not find a verifiable, comparable Nasdaq-100 P/E series for 2000, so we use the S&P 500 instead. Its forward P/E peaked at 24.4 on 24 March 2000 (FactSet), and its trailing P/E on reported earnings was 28.3 that month (Shiller). The Nasdaq-100 traded at 21.2 times forward earnings on 31 October 2026.
Is the stock market more concentrated now than in 2000? Yes. The ten largest stocks were 40.7% of the S&P 500 at the end of 2025, a record, against about 27% at the 2000 peak, according to RBC Wealth Management using FactSet data. Those ten companies were expected to earn about 32% of the index's 2025 profits.
What is a high Shiller CAPE ratio? Its long-run average is about 17. Readings above 30 have been rare: 1929, 1997–2002, much of 2017–2022, and every month since November 2023. The record is 44.2 in December 1999. High CAPE readings have been followed by lower ten-year returns on average, but they have not been reliable for timing a peak.