Is the AI Bubble About to Burst? What History Says
What the dot-com, Japan and China bubbles looked like before they burst, which crisis signals flash today (19 Nov 2026), and what to watch next.

Nobody can time the end of a bubble, but history gives a checklist, and on 19 November 2026 it did not read "burst". The AI bubble question is whether prices of AI-linked stocks have run far ahead of the cash the technology will earn. Past bubbles peaked after near-vertical run-ups (the Nasdaq rose 529% in the five years to March 2000) and broke when rates, credit and forced selling turned. Today the Nasdaq is up 90% over five years, and PickSkill's crisis board reads "no crisis signal", with four amber lights and one red.
That is not the same as "safe". Valuations are close to dot-com territory on some measures, AI spending is now larger than the telecom build-out of 2000, and several of the board's panic gauges moved from green to amber in November. This article compares today with the bubbles in PickSkill's crisis cycles set and lists the signals worth watching.
Key takeaways
- The run-up is steep, not dot-com steep: the Nasdaq Composite gained 90% in five years and 20% in one year to its 6 October 2026 high, against 529% and 109% before the March 2000 peak.
- Valuations are high but split: the Shiller CAPE was 40.1 in October 2026, near the 44.2 record of December 1999, while the S&P 500 forward P/E was 18.3 on 13 November 2026, well below the 24.4 of March 2000 (FactSet).
- Earnings are doing the heavy lifting: S&P 500 Q3 2026 earnings grew 31.9% and Information Technology 69.4% (FactSet, 13 Nov 2026).
- The board, 18–19 Nov 2026: S&P 500 −6.3% from its high, VIX 22.2, credit spread 1.53%. Amber: VIX, dollar +4.9%, stocks and gold falling together, Fed easing. Red: China home prices.
- What would change the picture: a credit spread above 2.5%, VIX above 30, a 20% drawdown, or AI spending that keeps outrunning free cash flow.
What did past bubbles look like before they burst?
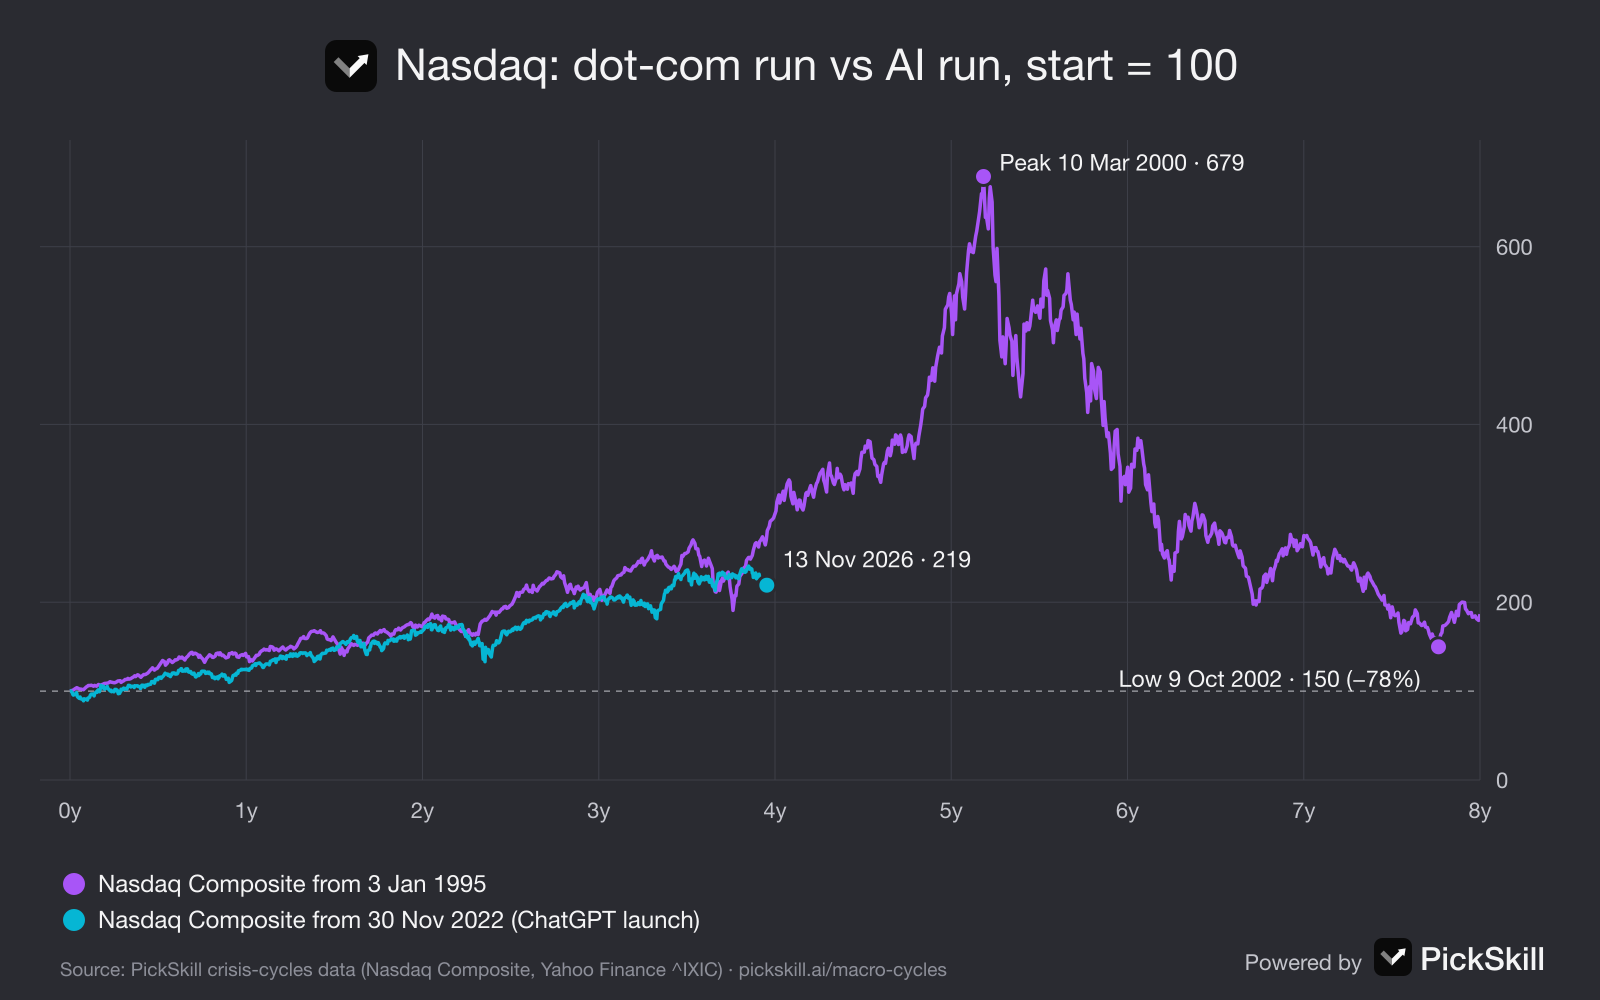
Past stock bubbles share three features before the top: a run-up that turned near-vertical in the final year, a story about a new era that justified any price, and a policy turn that raised the cost of money. The dot-com bust is the clearest case. The Nasdaq Composite rose 529% in the five years to its 10 March 2000 close of 5,048.62 and 109% in the final twelve months, while the Fed raised its target rate six times, from 4.75% in June 1999 to 6.5% in May 2000. It then fell 78% to 9 October 2002 and did not close above its 2000 high again until 23 April 2015. Japan in 1989 and China in 2015 followed the same arc with different triggers: a central-bank hiking cycle in Tokyo, a margin-lending crackdown in Shanghai.
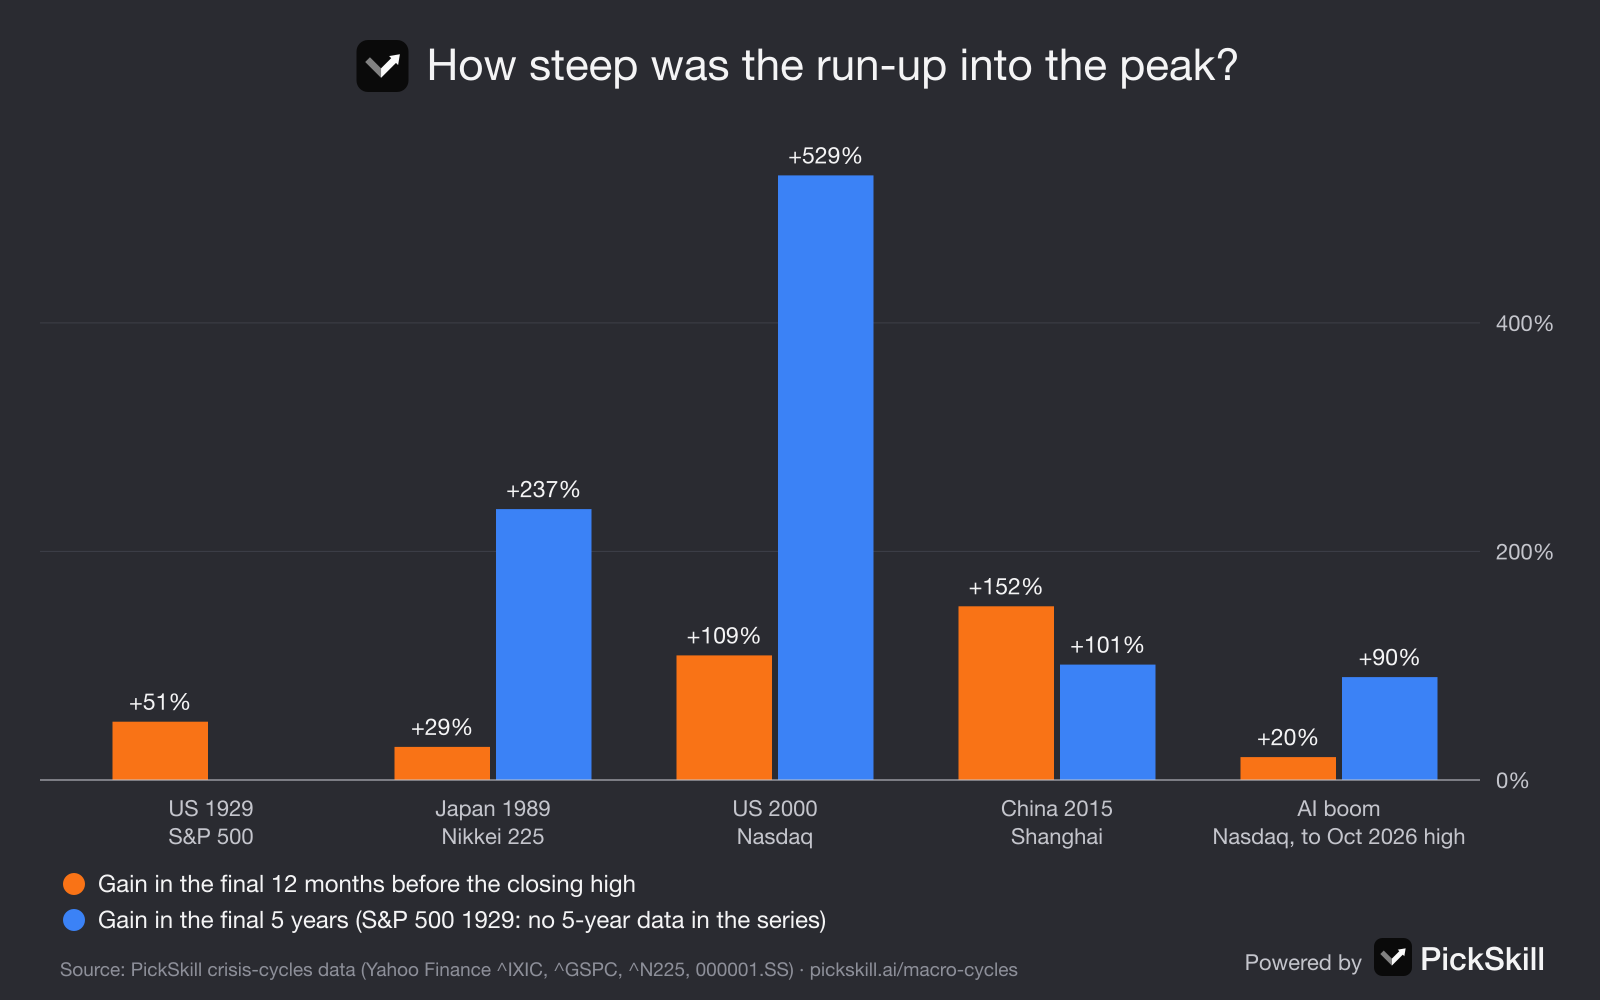
| Bubble | Run-up into the peak | What turned it | Fall, peak to trough | Back to the old high |
|---|---|---|---|---|
| US 1929 | S&P 500 +51% in the final year | Margin boom, Fed tightening, bank failures | −86% (to June 1932) | September 1954 |
| Japan 1989 | Nikkei 225 +237% in five years | BOJ hikes from 2.5% to 6%, property-lending cap | about −80% | February 2024 |
| US 2000 | Nasdaq +529% in five years | Fed hikes to 6.5%, profit warnings | Nasdaq −78%, S&P 500 −49% | Nasdaq April 2015 |
| China 2015 | Shanghai Composite +152% in one year | Margin deleveraging, RMB devaluation | −49% (to January 2016) | not regained |
| AI boom (so far) | Nasdaq +90% in five years, +119% since 30 Nov 2022 | — | −8.9% from the 6 Oct 2026 high (13 Nov) | — |
Source: PickSkill crisis-cycles data (closing prices via Yahoo Finance); policy events from the crisis write-ups on /macro-cycles.
Is the AI boom like the dot-com bubble?
It looks similar in shape and different in speed and in earnings. Measured from the launch of ChatGPT on 30 November 2022, the Nasdaq Composite had more than doubled (+119%) by 13 November 2026. At the same age, about four years in, the dot-com run measured from January 1995 was up 171%, and the steepest part, the final 15 months, was still ahead of it. Valuations rhyme more closely: Robert Shiller's cyclically adjusted P/E (CAPE) for the S&P 500 reached 41.1 in August 2026 and was 40.1 in October; before this year, it had only been higher in 1999 and 2000. The big difference is profits. In March 2000 investors paid 24.4 times next year's expected earnings; on 13 November 2026 they paid 18.3, because analysts' earnings estimates rose faster than prices. Our side-by-side of the dot-com bubble vs the AI boom goes through every measure.
What do serious analysts say about an AI bubble in 2026?
The most careful recent work lands in the same place: real technology, pockets of excess. In a CFA Institute Enterprising Investor post on 4 November 2026, Myles Zhang set out to prove AI was a bubble and ended up "more bullish", while rating financing risk "yellow". He cites an IMF count of 14 AI deals since 2023 with about $300 billion of equity and $650 billion of debt against $1.4 trillion of future revenue commitments, and Amazon's trailing free cash flow turning to −$7.6 billion. An arXiv paper by Qianan Wang and Zen Chen (June 2026) calls AI "a real technological revolution with localized bubble dynamics", pointing at private foundation-model firms, thin-margin AI applications and speculative data-centre projects.
The company numbers show why both views exist. On its Q3 2026 call, Alphabet reported Google Cloud revenue up 103% to $30.7 billion, and also $51.4 billion of quarterly capex, negative free cash flow of $9.1 billion and $924 billion of future purchase commitments. FactSet found that Alphabet, Amazon and Meta, the three "Magnificent 7" companies that missed Q3 EPS estimates, fell an average 7.8% around their reports: the market is no longer paying for spending without proof.
Which crisis warning signs are flashing today?
On data to 18–19 November 2026, PickSkill's signal board read "no crisis signal": none of the panic gauges was red and the Fed was not in rescue mode. But November moved several lights from green to amber, and that matters more than any single level. The table lists all eleven, with the thresholds explained in our guide to financial crisis warning signs.
| Signal | Reading | Light | Turns red at |
|---|---|---|---|
| S&P 500 below its high | −6.3% (high 6 Oct 2026) | Green | −20% |
| Stocks and gold falling together | −5.6% / −9.8% over 20 days to 18 Nov | Amber | −8% / −5% |
| VIX | 22.2 | Amber | 30 |
| Credit spread (Baa − 10Y) | 1.53% | Green | 3.5% |
| Dollar, 3 months | +4.9% | Amber | +6% |
| Yield curve (10Y − 2Y) | +0.27% | Green | re-steepening after inversion |
| Fed rate cycle | 3.88%, 145 bp below the 5.33% peak | Amber | rates near zero |
| Fed balance sheet, 3 months | 0.0% | Green | +5% |
| US home prices, 1 year | +2.1% (Aug 2026) | Green | −3% |
| China home prices, 1 year | −5.9% | Red | −3% |
| Gold, 12 months | −9.0% | Green | n/a (watch at +25%) |
Source: pickskill.ai/macro-cycles, live data as of 17–19 November 2026 (US homes to August, China homes to the latest BIS quarter).
Two readings outside the board are worth noting. The 10-year Treasury yield was 5.10% on 17 November 2026, up from 4.13% a year earlier, and US CPI inflation was 4.1% in October. In 2000 it was rising rates that pricked the bubble; in 2026 the Fed is cutting while long-term yields climb.
What should you watch next?
Watch the signals that turned past booms into busts, in roughly the order they have fired:
- Credit. The Baa spread at 1.53% says lenders are relaxed. A move above 2.5% would say the financing behind AI data centres is getting harder to roll.
- Free cash flow versus capex. Alphabet, Amazon and Meta are spending faster than they generate cash. Alphabet will give its 2027 capex outlook on its Q4 call; a cut, or a jump without revenue to match, would both be informative.
- Forced selling. Stocks and gold falling together is already amber. If it reaches −8% and −5% over 20 days, the board would mark it red, as in October 2008 and March 2020.
- Fear and the drawdown. VIX above 30 and an S&P 500 more than 20% below its high would, together with one more panic light, move the board to "first half of a crisis".
- Rates. A 10-year yield above 5% raises the discount rate on long-dated AI profits, the same mechanism that hurt growth stocks in 2022.
The first Fed rate cut is already behind us (September 2024), and history says it is not an all-clear: in 2001 the S&P 500 fell about 40% more after the first cut.
How can you check your own AI exposure?
Start with concentration, then signals. An S&P 500 index fund held about 41% in its ten largest stocks at the end of 2025 (RBC Wealth Management), so an "AI bubble" is not only a question for people who own NVIDIA. PickSkill's stock pages show the eight daily technical signals for each holding, the AI analyst can read your portfolio against the current crisis phase, and the crisis cycles page shows how each asset behaved in the dot-com bust and eleven other crises.
This article is for research and education only, not investment advice.
FAQ
Is the AI bubble about to burst? No indicator can say when, and the evidence is mixed. On 19 November 2026 PickSkill's rule-based crisis board read "no crisis signal", with VIX at 22.2 and the credit spread at 1.53%. Valuations are high on the Shiller CAPE (40.1 in October) but moderate on forward earnings (18.3).
How does the AI boom compare with the dot-com bubble? The Nasdaq gained 529% in the five years to March 2000 and 90% in the five years to its October 2026 high. The S&P 500 forward P/E was 24.4 in March 2000 and 18.3 in November 2026, because earnings are growing fast. The top ten stocks are a larger share of the index today.
What happened to stocks after the dot-com bubble burst? The Nasdaq Composite fell 78% from 10 March 2000 to 9 October 2002 and did not close above its 2000 high until April 2015. The S&P 500 fell 49%. Gold, cash and US homes did better while stocks fell, as the dot-com page of PickSkill's crisis cycles shows.
What are the warning signs that an AI bubble is bursting? Watch credit spreads above 2.5%, a VIX above 30, stocks and gold falling together, a 20% fall from the high, and AI spending that keeps outrunning free cash flow. Two or more panic signals at once has historically marked the first half of a crisis.
Are AI stocks overvalued in 2026? It depends on the measure. The S&P 500 CAPE of 40.1 (October 2026) had only been exceeded in 1999–2000 and earlier in 2026, while the forward P/E of 18.3 is below its 10-year average of 19.1 (FactSet, 13 November 2026). Individual AI stocks vary widely.