RSI vs Stochastic: Which Is Better, and Using Both
RSI vs stochastic: formulas, 70/30 vs 80/20, trend behaviour, divergences, and S&P 500 data on how often they agree. Plus a 5-step way to use both.
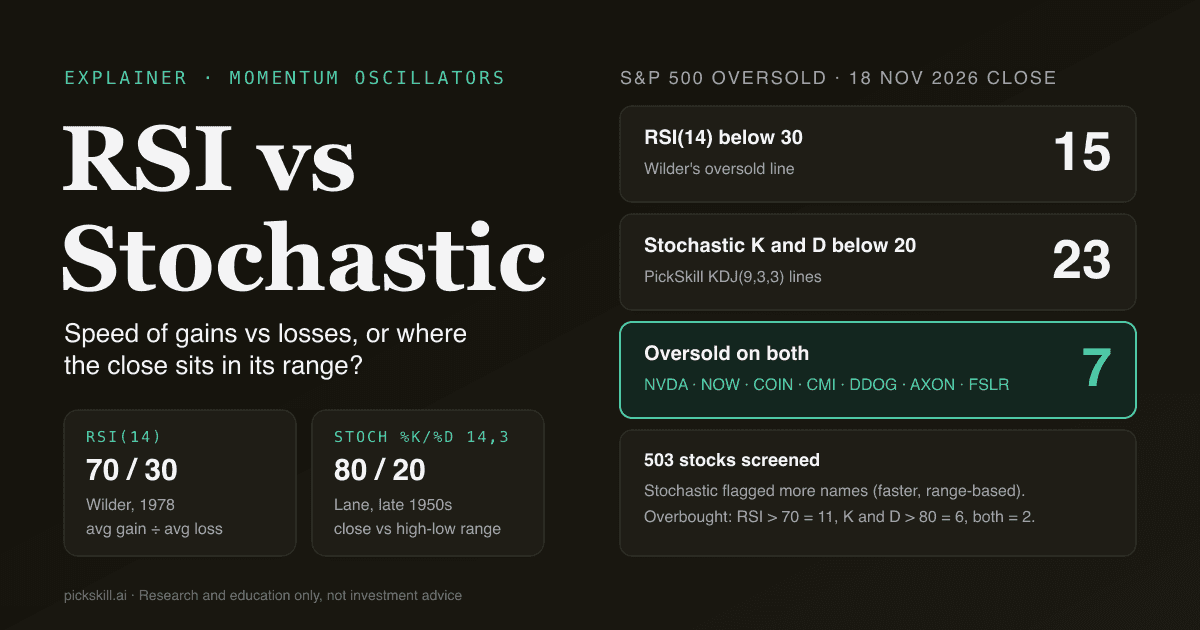
Neither RSI nor the stochastic oscillator is better in general: RSI measures how large recent gains are compared with recent losses, while the stochastic measures where today's close sits inside the recent high-low range, so the stochastic reacts faster and RSI is steadier. RSI vs stochastic is a choice between a smoother momentum gauge (Wilder's RSI, 14 periods, 70/30) and a faster range gauge (Lane's %K/%D, 14 and 3 periods, 80/20). On the 18 Nov 2026 close, 15 of 503 S&P 500 stocks had RSI(14) below 30, 23 had stochastic-family K and D lines below 20 in PickSkill's signal table, and only 7 were oversold on both.
That overlap is the practical answer to "which is better": the two agree less often than most traders assume, and where they disagree tells you something about the trend.
Key takeaways
- Different questions: RSI asks "how strong were up days versus down days?"; the stochastic asks "is the close near the top or bottom of the recent range?"
- Different levels: RSI uses 70/30 (Wilder, 1978); the stochastic uses 80/20 (the traditional settings for George Lane's indicator).
- The stochastic is more sensitive: on 18 Nov 2026 it flagged 23 S&P 500 stocks as oversold versus 15 for RSI, and the 16 stochastic-only names had RSI readings between 30.0 and 43.6.
- They overlap less than you think: only 7 stocks were oversold on both, and only 2 (Edwards Lifesciences and Clorox) were overbought on both.
- Best use is together: let RSI define the regime and the stochastic time the turn, then confirm with a trend tool.
What is the difference between RSI and the stochastic oscillator?
The difference is what each one compares. RSI, the Relative Strength Index, compares the average size of up closes with the average size of down closes over 14 periods and maps the ratio to a 0–100 scale. The stochastic oscillator compares the latest close with the highest high and lowest low of the last 14 periods: a reading of 100 means the stock closed at the top of its range, 0 means it closed at the bottom. Both are bounded momentum oscillators used for overbought/oversold readings and divergences, but RSI uses only closes, while the stochastic also uses highs and lows, so it reacts much faster to a single strong close. If you want the full background on either one, read what is RSI and what is the stochastic oscillator.
| RSI | Stochastic oscillator | |
|---|---|---|
| Creator | J. Welles Wilder Jr., New Concepts in Technical Trading Systems (1978) | George C. Lane, late 1950s |
| What it measures | Speed and size of gains vs losses | Position of the close within the high-low range |
| Inputs | Closes only | High, low and close |
| Default settings | 14 periods | %K 14 periods, %D 3-period average of %K |
| Overbought / oversold | 70 / 30 | 80 / 20 |
| Signal line | None by default | %D (crossovers with %K) |
| Sensitivity | Smoother, slower | Faster, choppier |
| Best regime | Trends and pullbacks within trends | Trading ranges and zig-zag trends |
| Typical failure | Stays above 70 / below 30 for weeks in strong trends | Whipsaws across 80/20 in noisy markets |
How are RSI and the stochastic calculated?
RSI is calculated as RSI = 100 − 100 / (1 + RS), where RS is the average gain divided by the average loss over 14 periods. The first averages are simple 14-period means; after that, Wilder smoothing applies: average gain = (previous average gain × 13 + current gain) / 14, and the same for losses, as StockCharts' ChartSchool RSI page sets out. Because each new day only moves the average by one fourteenth, RSI changes gradually.
The stochastic is %K = (close − lowest low) / (highest high − lowest low) × 100 over 14 periods, and %D is a 3-period simple moving average of %K, per ChartSchool's stochastic oscillator page. Lane's own description, quoted there, is that the stochastic "follows the speed or the momentum of price" and that "as a rule, the momentum changes direction before price."
PickSkill computes RSI(14) with this Wilder smoothing. Its stochastic-family indicator is KDJ(9,3,3), standard in Chinese charting software: a 9-period raw stochastic smoothed into K and D with a one-third weighting, plus J = 3K − 2D. Same "close within range" idea, shorter lookback, so a slightly faster stochastic. The KDJ vs RSI post covers that variant in depth.
Which is more sensitive, RSI or stochastic?
The stochastic is more sensitive than RSI, and the S&P 500 shows it. At the 18 Nov 2026 close, PickSkill's screener scanned 503 S&P 500 stocks: RSI(14) was below 30 for 15, while stochastic-family K and D were both below 20 for 23. The 16 stochastic-only names, from Capital One (RSI 30.0) to Amcor (RSI 43.6), closed near the bottom of their 9-day range without enough sustained selling to push RSI under 30. In the other direction, 8 stocks were RSI-oversold but not stochastic-oversold. Five were near misses where the slower D line was still just above 20, at 21.5 to 25.0 (Salesforce, Freeport-McMoRan, Robinhood, Boeing), or K sat at 20.8 (Archer Daniels Midland). Three had already bounced off their lows: UnitedHealth (K 34.8), Intel (K 32.5) and Caterpillar (K 30.6). Using PickSkill's broader KDJ "bullish" signal instead, which also counts a K-over-D cross below 50, gives 43 stocks, but the overlap with RSI below 30 is the same 7.
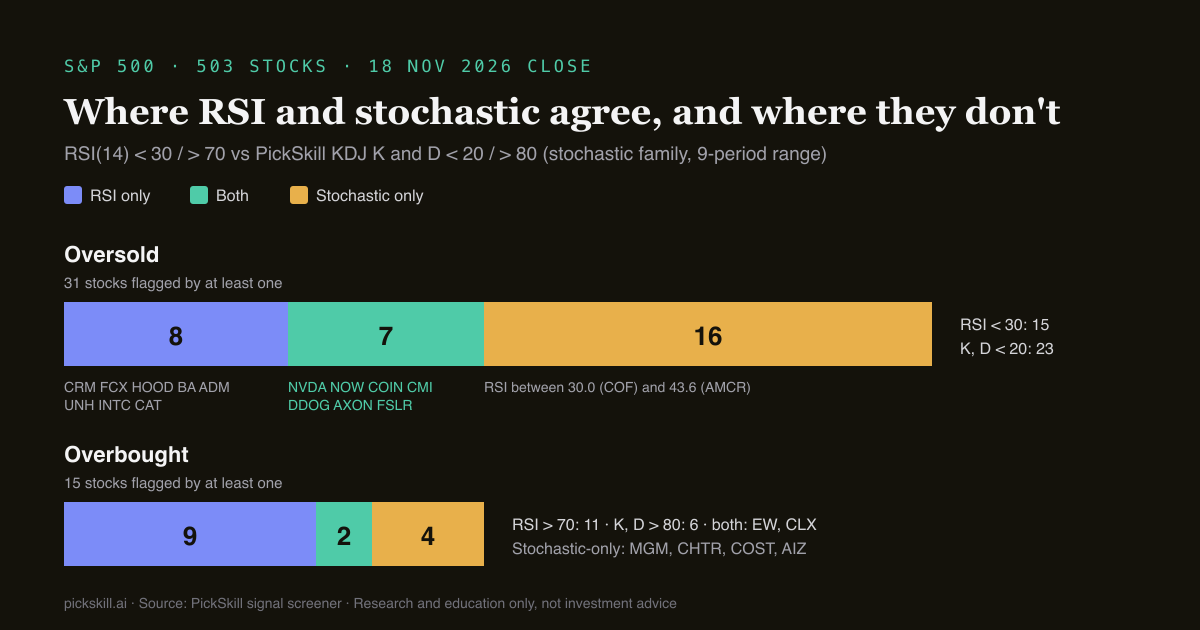
That second group is the lesson: a small bounce lifts the stochastic out of oversold in a day or two, while RSI needs several up days to recover. The stochastic says the close has left the low; RSI says whether weeks of selling pressure have really eased.
Why does RSI use 70/30 and stochastic 80/20?
RSI uses 70/30 because Wilder defined overbought as above 70 and oversold as below 30 when he introduced the indicator in 1978. The stochastic uses 80/20 because its readings swing to the extremes far more easily: a single close at the top of a 14-day range already reads 100, so the bands sit wider to filter routine moves. These are conventions, not laws: ChartSchool notes that RSI tends to hold roughly between 40 and 90 in uptrends and 10 to 60 in downtrends (an observation from Constance Brown), so many traders shift the bands with the trend. On the overbought side on 18 Nov 2026, 11 S&P 500 stocks had RSI above 70 and 6 had K and D above 80, with only Edwards Lifesciences and Clorox on both lists.
How do RSI and stochastic behave in strong trends?
Both oscillators can stay at extremes for a long time in a strong trend, but they fail differently. The stochastic pins near 100 or 0 whenever price keeps closing near the edge of its range, then whips across 80 or 20 on every small pullback; ChartSchool's guidance is that "overbought readings aren't necessarily bearish" and that a security "can become overbought and remain overbought during a strong uptrend." RSI moves more slowly and gives fewer false exits, but can sit above 70 or below 30 for weeks. For both, the fix is to favour signals in the trend's direction: in an uptrend, act on occasional oversold readings and ignore frequent overbought ones. All 7 stocks oversold on both indicators on 18 Nov 2026 were down over the previous five sessions, from −4.7% (Axon) to −18.9% (Coinbase), with NVIDIA at RSI 21.1 after a 13.1% drop; falling markets are exactly where oversold signals mislead most. The MACD vs RSI guide explains how to add a trend filter.
Are RSI or stochastic divergences more reliable?
RSI divergences are usually the more reliable of the two because RSI is smoother, so its swing highs and lows are cleaner. A bullish divergence forms when price makes a lower low but the oscillator makes a higher low; a bearish divergence is a higher price high with a lower oscillator high. ChartSchool explains Wilder's view that divergences flag potential reversals because "directional momentum does not confirm price." Lane went further and called a %D divergence the "only signal which will cause you to buy or sell," per ChartSchool. The stochastic simply produces more, smaller divergences, so prefer ones that form inside its 80/20 zones. See what is divergence for a step-by-step method.
How do you use RSI and stochastic together?
You use RSI and the stochastic together by giving each a different job: RSI sets the regime, the stochastic times the entry, and a trend tool vetoes bad setups. Stacking two oscillators that say the same thing adds little, so split their roles:
- Read the trend first. Check price against the 50- or 200-day moving average, or ADX. Oversold signals in a strong downtrend need extra confirmation.
- Use RSI for the regime. RSI holding 40–50 on pullbacks suggests an uptrend; failing at 50–60 suggests a downtrend.
- Use the stochastic for timing. Within that regime, wait for %K to cross %D out of the 20 zone (for longs) or the 80 zone (for exits).
- Require agreement at extremes. A stock below RSI 30 and below stochastic 20 is stretched on both closes and range; that was 7 of 503 S&P 500 stocks on 18 Nov 2026.
- Check for divergence and fundamentals. A bullish RSI divergence plus a stochastic cross is stronger than either alone, and news or earnings can still override both.
In PickSkill's signal screener you can build step 4 as a single screen: "rsi.rsi < 30" and "kdj.k < 20" and "kdj.d < 20", optionally adding a KDJ "turned bullish" event to catch the cross. The indicators page explains how each of the eight signal dimensions is computed; screens refresh after each market close and show the values behind every match.
So which should you choose?
Choose RSI if you want fewer, steadier signals that work across trends and suit divergence analysis. Choose the stochastic if you trade ranges or short swings and accept more whipsaws for earlier turns. Better still, use both and read their disagreements: RSI-oversold but not stochastic-oversold means the stock has already bounced; stochastic-oversold with RSI near 40 may be a pullback inside an intact trend. Data here is as of the 18 Nov 2026 close and changes daily. This post is for research and education only, not investment advice.
FAQ
Is RSI or stochastic better for day trading? The stochastic is usually preferred for short-term and intraday trading because it reacts to where price closes within its range, so it turns earlier than RSI. That speed also brings more false signals, so many add a trend filter, such as taking stochastic buy signals only above a rising moving average.
What are the best settings for RSI and stochastic together? The standard pairing is RSI(14) with 70/30 bands and a slow stochastic (14,3) with 80/20 bands. These are the settings documented by StockCharts' ChartSchool. Shorter periods make both more sensitive; longer ones smooth them. Change one setting at a time and test it on your own market before trusting it.
Why is RSI oversold but stochastic not? It usually means the stock has bounced off its recent low. A small rally lifts the close away from the bottom of the high-low range, so the stochastic leaves its oversold zone quickly, while RSI still reflects weeks of heavy losses. On 18 Nov 2026, 8 S&P 500 stocks were RSI-oversold but not stochastic-oversold.
Is KDJ the same as the stochastic oscillator? KDJ is a variant of the stochastic oscillator. K and D follow the same "close within the high-low range" logic, usually over 9 periods with a one-third smoothing, and KDJ adds a J line (3K − 2D) that exaggerates extremes. Thresholds of 80/20 apply to K and D as with a standard stochastic.