Weekly MACD Golden Cross: How to Confirm It
Weekly vs daily MACD golden cross, and how reliable it is: a six-point confirmation checklist tested on real Tencent (0700.HK) weekly data.
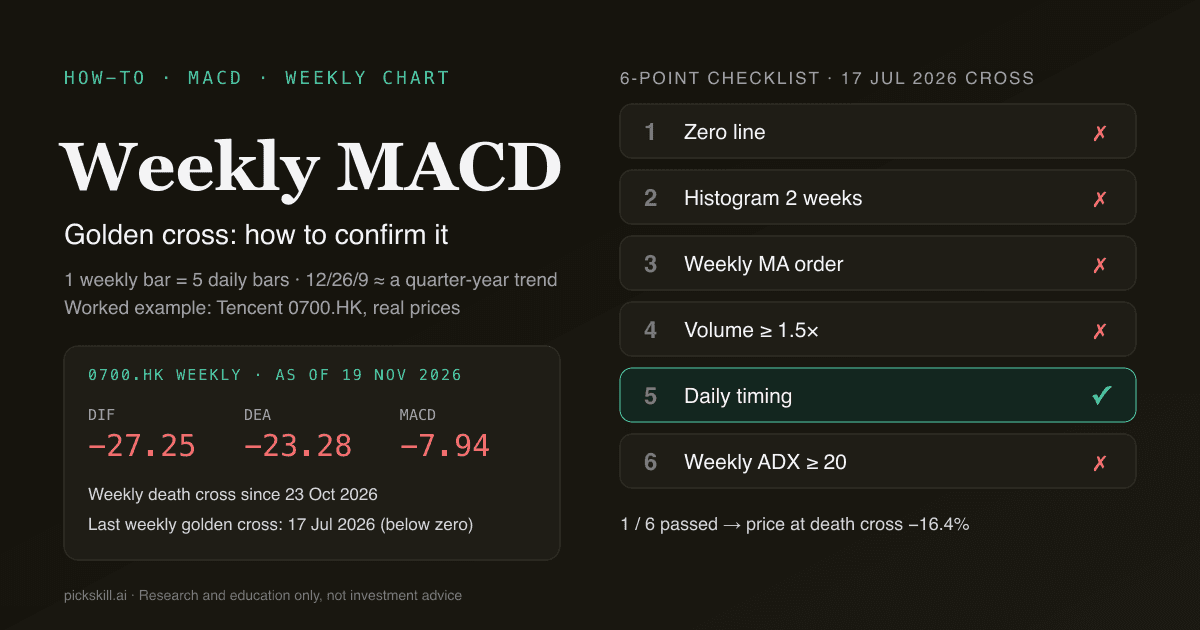
To confirm a weekly MACD golden cross, wait for the weekly bar to close, then check six things: zero-line position, two weeks of histogram expansion, weekly moving-average order, volume, daily-chart timing and weekly ADX. A weekly MACD golden cross is the DIF line crossing above the DEA (signal) line on weekly closing prices; the 12/26/9 settings are the same as on a daily chart, but one weekly bar spans five daily bars, so the signal tracks roughly a quarter-year trend. On Tencent (0700.HK), the daily MACD produced 19 golden crosses between November 2024 and November 2026, the weekly MACD only 4 (PickSkill calculation from Yahoo Finance daily prices, as of 19 Nov 2026).
Fewer signals make each weekly cross worth checking carefully, but fewer does not mean more accurate. Below we run Tencent's last five weekly golden crosses through the checklist to see which conditions actually separate good signals from bad ones. Daily false-signal filters are covered in How to Confirm a MACD Golden Cross; this post stays on the weekly timeframe.
Key takeaways
- Weekly MACD(12,26,9) spans about 12 weeks (~60 trading days), 26 weeks (half a year) and 9 weeks, so it reads quarter-scale trend changes. Tencent had 19 daily golden crosses but only 4 weekly ones in two years.
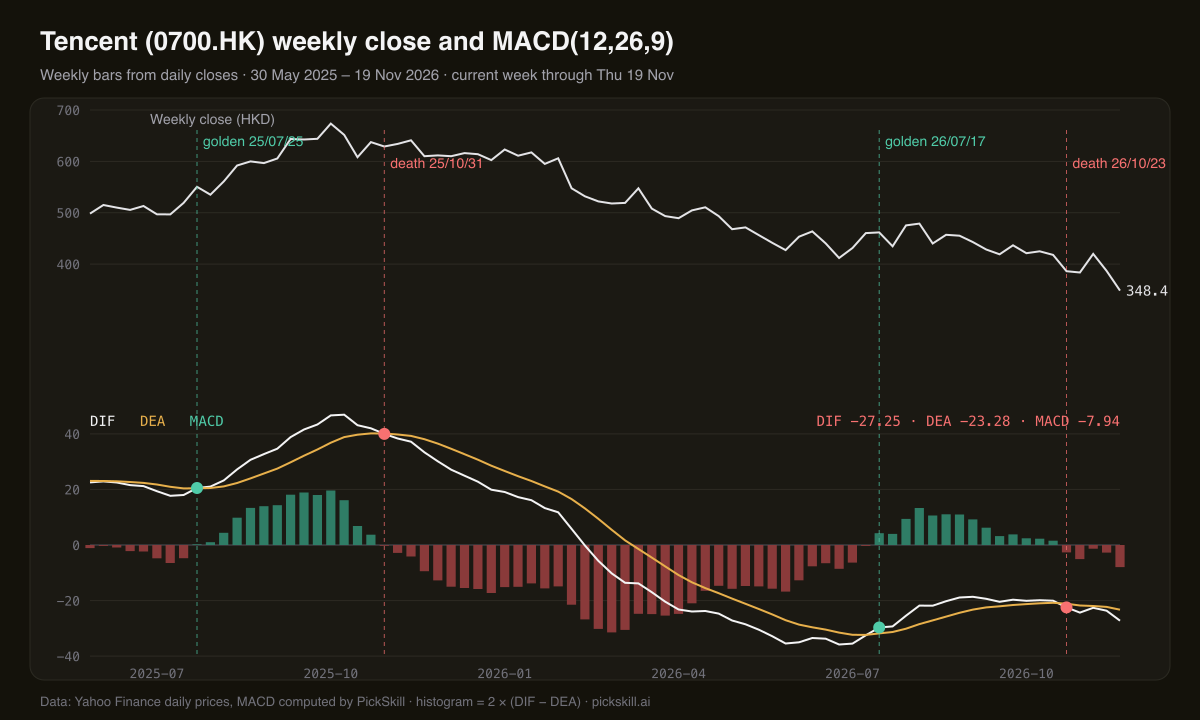
- As of Thursday 19 Nov 2026, Tencent's weekly DIF is -27.25, DEA -23.28 and the MACD histogram -7.94: below zero, after a weekly death cross on 23 Oct 2026, with the negative histogram widening for two weeks.
- The last weekly golden cross, on 17 Jul 2026, formed below zero and passed only 1 of 6 checks. By the 23 Oct death cross, the weekly close had fallen from HK$461.6 to HK$386.0 (-16.4%).
- The three crosses that passed 5 of 6 checks (Sep 2024, Feb 2025, Jul 2025) saw peak weekly closes 9.1%, 12.4% and 22.3% above the cross week, yet two of the three were lower by the time the weekly death cross arrived.
- Without a weekly chart, a daily MACD(60,130,45) approximates the weekly one; on Tencent its crossovers land within a few trading days of the weekly crosses.
- All figures illustrate a method and are not trading recommendations.
What is the difference between a weekly and a daily MACD golden cross?
Both use the same formula: DIF is the 12-period EMA minus the 26-period EMA, DEA is a 9-period EMA of DIF, and a golden cross is DIF crossing above DEA. Only the length of a period changes. On a daily chart, 12/26/9 covers about two and a half weeks, five weeks and two weeks. On a weekly chart the same settings cover 12 weeks (about a quarter), 26 weeks (half a year) and 9 weeks (two months). A daily cross asks "has momentum improved over the past few weeks?"; a weekly cross asks "is this quarter's trend turning?". The cost is lag: a weekly cross only counts at the Friday close and usually arrives weeks after the daily one. Tencent printed 19 daily and 4 weekly golden crosses over two years, roughly one weekly cross for every five daily ones.
| Daily MACD golden cross | Weekly MACD golden cross | |
|---|---|---|
| One bar | 1 trading day | 5 trading days (Mon–Fri) |
| 12/26/9 spans | ~2.5 wk / 5 wk / 2 wk | ~1 quarter / 6 months / 2 months |
| Tencent crosses, Nov 2024–Nov 2026 | 19 | 4 |
| Confirmed at | Daily close | Last trading day of the week |
| Main use | Timing, short-term momentum | Medium-term trend direction |
| Typical weakness | Whipsaws in ranges | Lag, late exit signals |
Source: PickSkill calculation from Yahoo Finance 0700.HK daily prices, 8 Nov 2024 to 19 Nov 2026. For the basics, start with What Is MACD?.
How do you calculate or approximate a weekly MACD?
The precise way is to build weekly bars from daily data (first open, highest high, lowest low, last close, summed volume for each Monday–Friday week) and compute EMA(12), EMA(26) and the 9-period DEA on the weekly closes. EMAs need a long warm-up, so we used five years of daily prices (from Nov 2021, 262 weekly bars) to make the latest values independent of the starting point. Hong Kong holiday weeks with three or four sessions still form one bar. Two traps are common. First, until Friday's close the current weekly bar is unfinished and its values will move. Second, histogram conventions differ: Chinese charting apps and PickSkill stock pages plot 2 × (DIF − DEA), while many Western platforms plot DIF − DEA, so the bars differ by a factor of two but cross dates are identical.
If you only have daily tools, multiply the settings by five and use a daily MACD(60,130,45). On Tencent, that proxy crossed on 17 Feb 2025, 29 Jul 2025, 16 Jul 2026 and 22 Oct 2026, against weekly crosses in the weeks ending 14 Feb 2025, 25 Jul 2025, 17 Jul 2026 and 23 Oct 2026, all within a few trading days. It is not identical (the EMA updates daily rather than on Friday closes), but direction and rhythm match closely.
How do you confirm a weekly MACD golden cross? A six-point checklist
The cross on its own carries little information. Each check below targets one way weekly crosses fail: four look at the weekly chart, one drops to the daily chart and one measures trend strength. The thresholds are ours, set to make the method concrete, not a universal standard.
- Zero line: DIF ≥ 0 at the cross. Crosses below zero are often bounces inside a downtrend.
- Histogram expands for two weeks: in each of the two weeks after the cross, the positive bar is taller than the week before. This costs two weeks of waiting but filters out one-week crosses.
- Weekly moving-average order: weekly close > 10-week MA > 20-week MA (roughly the 50-day and 100-day).
- Volume: cross-week volume at least 1.5× the prior 20-week average. See What Is Volume Analysis?.
- Daily timing: daily DIF above DEA and the daily close above its 20-day MA. The weekly sets direction; the daily finds the entry.
- Weekly ADX ≥ 20: ADX(14) on weekly bars, with +DI above −DI. A low ADX means a weak trend in which crosses tend to flip back and forth.
How did Tencent's (0700.HK) weekly golden crosses score?
Across Tencent's five weekly golden crosses since September 2024, more checks passed went with more upside, but the weekly death cross was consistently a late exit. The 17 Jul 2026 cross is the clearest case: DIF was -29.70, below zero; the histogram shrank from 4.24 to 4.01 in week one; the 10-week MA (444.7) sat below the 20-week MA (472.6); volume was only 1.13× the 20-week average; weekly ADX was 16.4. Only daily timing passed. The best weekly close afterwards was HK$478.8 (+3.7%), and by the 23 Oct 2026 death cross the close was HK$386.0, 16.4% below the cross week. The 23 May 2025 cross was above zero but came on 0.54× average volume, its histogram turned negative the next week, and it died one week later.
| Weekly golden cross (Fri close, HK$) | Zero | Hist 2 wk | MAs | Volume | Daily | ADX | Score | Peak close after | At weekly death cross |
|---|---|---|---|---|---|---|---|---|---|
| 27 Sep 2024 (437.8) | ✓ | ✗ | ✓ | ✓ 2.34× | ✓ | ✓ 28.3 | 5/6 | +9.1% | -8.4% (7 wk) |
| 14 Feb 2025 (474.8) | ✓ | ✓ | ✗ | ✓ 1.94× | ✓ | ✓ 23.9 | 5/6 | +12.4% | -3.5% (9 wk) |
| 23 May 2025 (518.0) | ✓ | ✗ | ✓ | ✗ 0.54× | ✓ | ✓ 25.4 | 4/6 | 0% | -3.8% (1 wk) |
| 25 Jul 2025 (550.5) | ✓ | ✓ | ✓ | ✗ 1.04× | ✓ | ✓ 22.5 | 5/6 | +22.3% | +14.3% (14 wk) |
| 17 Jul 2026 (461.6) | ✗ | ✗ | ✗ | ✗ 1.13× | ✓ | ✗ 16.4 | 1/6 | +3.7% | -16.4% (14 wk) |
Source: PickSkill calculation on weekly bars built from Yahoo Finance 0700.HK daily prices. Five crosses is a demonstration of the checklist, not a backtest.
Three lessons stand out. First, daily timing passed all five times: by the time a weekly cross prints, the daily chart is almost always already bullish, so this check is about not chasing, ideally waiting for a daily pullback and re-cross, rather than a filter. Second, what separated July 2026 from the rest was the zero line, MA order and ADX. Third, the weekly death cross exits late: the Sep 2024 cross was up 9.1% at its best and down 8.4% by the death cross, so exits are better managed on the daily chart or moving averages.
Is a weekly golden cross reliable?
A weekly golden cross is cleaner than a daily one because it takes a quarter-scale price move to trigger, so it whipsaws far less in ranges; Tencent's 4 weekly versus 19 daily crosses show that. It has two built-in weaknesses. One is lag: Tencent's 17 Jul 2026 cross week closed at HK$461.6, already 12.1% above the HK$411.8 weekly-close low of 26 Jun 2026. The other is that a below-zero weekly cross mostly means a downtrend is losing speed, not reversing, which is exactly what happened in July 2026. The safer reading treats a weekly golden cross as confirmation of trend direction, not an entry by itself: it needs the zero line, histogram, MAs and ADX to agree, with the daily chart for timing. StockCharts' ChartSchool MACD entry covers the formula and its limits.
Where does Tencent's weekly MACD stand now?
As of the Thursday 19 Nov 2026 close, Tencent's weekly DIF is -27.25, DEA -23.28 and the histogram -7.94, below zero following the 23 Oct 2026 weekly death cross. The last three histogram bars read -1.33, -2.73 and -7.94, widening for two weeks. Weekly MAs are in bearish order (5-week 384.88 < 10-week 404.38 < 20-week 428.88 < 30-week 434.73), with the HK$348.4 weekly close below all of them. Weekly ADX is 13.4 with −DI 27.7 above +DI 18.0: bearish direction, weak trend. Four sessions into the week, volume is 148.4 million shares against a prior 20-week average of 123.6 million. DIF would need to close a gap of about 3.97 to DEA for the next weekly golden cross. This week's bar is not final until the Friday 20 Nov close.
On the daily chart, the PickSkill Tencent stock page shows a 19 Nov close of HK$348.40 (-6.55% on the day); daily MACD DIF -10.77, DEA -6.61, histogram -8.32 after a daily death cross on 17 Nov; RSI(14) at 27.9, in oversold territory; daily ADX 22.1 with −DI 42.4 well above +DI 14.7. A daily oversold reading inside a weakening, below-zero weekly MACD is the classic "daily may bounce, weekly trend unchanged" setup. Live quotes are on the HKEX quote page.
How do you use PickSkill alongside the weekly chart?
PickSkill's eight indicator dimensions (MACD, moving averages, RSI, KDJ, Bollinger Bands, ADX/DMI, volume and money flow) are daily, each with a five-day signal trail. A practical split: read weekly direction in your charting app or compute it as above, and check the daily items (daily MACD cross, close above the 20-day MA, ADX, volume ratio) on the stock page. To find daily golden crosses across a basket of Hong Kong stocks and stack confirmations, use the PickSkill signal screener with the Hang Seng universe and the MACD golden cross event, plus MA, volume-ratio and ADX conditions; the CSI 300 golden-cross screen walks through a full five-layer filter. Then switch each name to the weekly chart and run the six-point checklist.
Research and education only, not investment advice.
FAQ
What is the difference between a weekly and a daily MACD golden cross? The formula is identical, DIF crossing above DEA; only the bar length differs. One weekly bar equals five trading days, so 12/26/9 spans about a quarter, half a year and two months, tracking the medium-term trend. Weekly crosses are rarer and later: Tencent (0700.HK) had 19 daily and 4 weekly golden crosses from November 2024 to November 2026.
How do you confirm a weekly MACD golden cross? Wait for the Friday close, then check six items: the cross is above the zero line; the histogram grows in each of the next two weeks; the weekly close is above the 10- and 20-week MAs with the 10-week above the 20-week; cross-week volume is at least 1.5× the 20-week average; the daily MACD is also bullish; and weekly ADX is 20 or higher. More passes mean a sturdier signal.
Is a weekly MACD golden cross reliable? It is less noisy than a daily cross but no guarantee. Of Tencent's last five weekly golden crosses, the three that passed five checks saw peak closes 9.1% to 22.3% above the cross week; the 17 Jul 2026 cross, passing one check, was down 16.4% by the weekly death cross. Weekly death crosses tend to be late exits, and five cases are too few for win-rate statistics.
Can a daily MACD approximate the weekly MACD? Yes. Multiply the settings by five and use a daily MACD(60,130,45). On Tencent (0700.HK), the proxy crossed on dates such as 16 Jul and 22 Oct 2026, versus weekly crosses in the weeks ending 17 Jul and 23 Oct 2026, a gap of a few trading days. It is not identical, but direction and timing are close enough when you only have daily charts.
Is Tencent (0700.HK) in a weekly golden cross or death cross now? As of 19 Nov 2026 (Thursday), Tencent's weekly MACD sits after the 23 Oct 2026 death cross: DIF -27.25, DEA -23.28, histogram -7.94, below zero, with the negative bars widening for two weeks and weekly ADX at 13.4. The last weekly golden cross was on 17 Jul 2026. The current weekly bar is final only at the 20 Nov close. This is a data description, not advice.