How to Get an AI Second Opinion on a Stock
A 7-step routine for an AI second opinion on a stock: write your thesis, run five models, check where they disagree, then set your own levels.
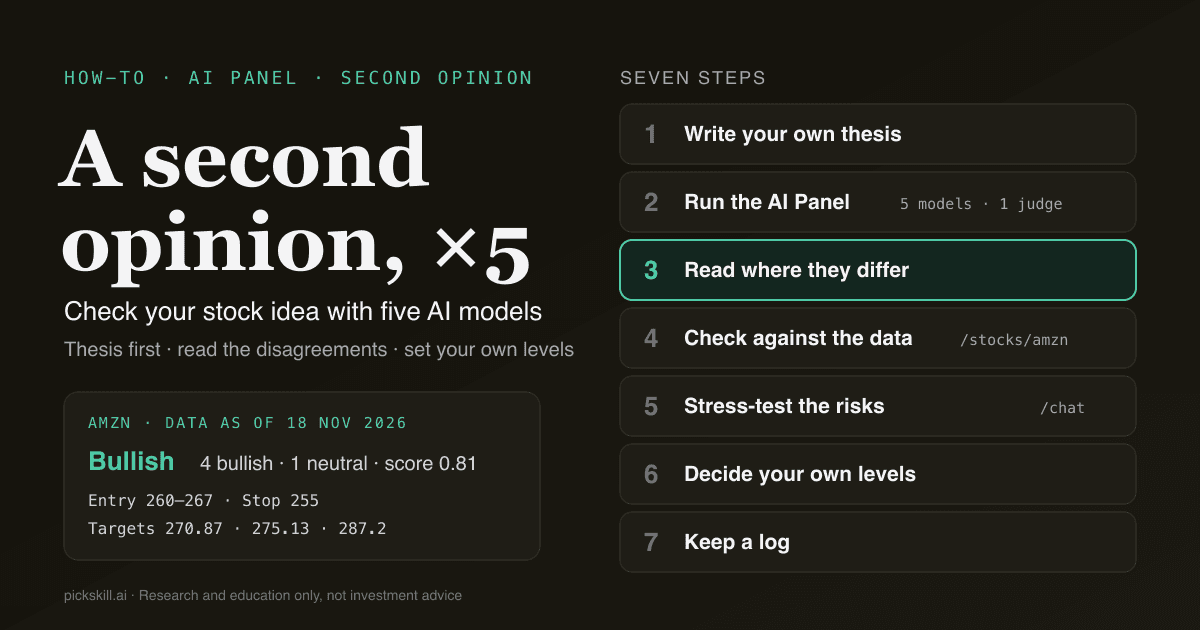
To get an AI second opinion on a stock, write down your own thesis first, then ask several AI models to analyse the same data independently and spend your time on the points where they disagree. An AI second opinion is a structured check of your idea by models that did not write it; it is useful because it shows you what to verify, not because it tells you what to buy. In 11 PickSkill AI Panel runs logged between 17 and 19 Nov 2026, the answering models agreed on a single stance only 3 times, and the judge listed at least two disagreements in all 11.
A single chatbot answer is easy to over-trust. Five answers that read the same facts and still differ give you a map of where the uncertainty sits. Below is the routine, with a real example: Amazon (AMZN) as of the 18 Nov 2026 close.
Key takeaways
- Thesis first, AI second. Write your view, your reason and the price that would prove you wrong before you look at any model output.
- Use several models on the same data. PickSkill's AI Panel has five models read one fact sheet, so when they differ it is the reasoning that differs, not the inputs.
- Disagreements are the to-do list. The verdict is a summary; the "Where they differ" section is where your research starts.
- Check every disputed point against the data, on the stock's signal page and in the company's filings.
- The levels are yours. Model stops and targets are reference points. In the AMZN run, four models put the stop around 254 to 256, and one put it at 238.
- Keep a log, so you can see later whether the second opinion actually helped.
What is an AI second opinion on a stock?
An AI second opinion on a stock is an independent review of your investment idea by one or more AI models that were not involved in forming it. Like a second medical opinion, the goal is to catch what you missed and surface risks you have not priced in. It works best when the models see the same dated facts (price action, technical signals, valuation, latest earnings) and answer separately. The output you want is not "buy" or "sell" but a short list: where the evidence is solid, where it is contested and what to check before acting. On PickSkill, the AI Panel does this with DeepSeek V4 Pro, Qwen 3.8 Max, Kimi K3, GLM-5.3 and MiniMax M2.5, with DeepSeek V4 Pro also acting as the judge.
How do you get an AI second opinion on a stock, step by step?
You get a useful AI second opinion by keeping your own thinking separate from the models' output, then using the models to find the weak spots. Every step below maps to a screen that exists in PickSkill today. If you have not looked at the stock yet, start with the 15-minute research routine and come back here once you have a view.
- Write your own thesis. One sentence for the view, three reasons, the price that would prove you wrong and your time horizon.
- Run the AI Panel. Open /panel, type a ticker, company name or pinyin (for example NVDA, 0700 or Moutai) and press Analyse.
- Read the vote, then the disagreements. Note the vote, the conviction-weighted score, "Where they agree" and "Where they differ".
- Check each disagreement against the data. Open the stock's signal page from the panel header and confirm the numbers the models argue about.
- Stress-test the risks with the AI analyst. Take the strongest bear points to /chat and ask follow-up questions.
- Decide your own levels. Compare your stop and entry with the five models' levels and the combined strategy, then pick yours.
- Log it. Save your thesis, the panel verdict and what you decided, and review it when the stock reaches one of your levels.
Why should you write your own thesis before asking the AI?
You should write your thesis first because once you have read five confident answers, it becomes very hard to remember what you actually thought. Anchoring is real: the first number you see becomes the reference for every later judgement. A written thesis turns the AI output into a comparison instead of a replacement. Keep it short: the view (for example "AMZN can retest its recent high within weeks"), three reasons, an invalidation price and a horizon. If you cannot write the invalidation price, that gap is itself the first thing to research.
What does the AI Panel show you?
The AI Panel shows five independent model views of one stock side by side, followed by one combined verdict from a judge model. Each model card carries a stance (bullish, bearish or neutral), a conviction from 1 to 5, a horizon in days, weeks or months, and expandable "Why", "Risks" and "Strategy" sections, where the strategy gives an entry zone, a stop or invalidation level and price targets. The verdict block shows the vote, a conviction-weighted score from -1 to +1, "Where they agree", "Where they differ", a combined strategy and "What to watch". Strategies are long-only: a bearish read means reduce or stay out, never short. A new analysis uses one of your monthly AI Panel runs (Free 1, Starter 10, Pro 50, Power 200, per pricing); a stock already analysed today loads instantly at no cost, and a run keeps going on the server if you leave the page.
Worked example: what did five models say about AMZN on 18 Nov 2026?
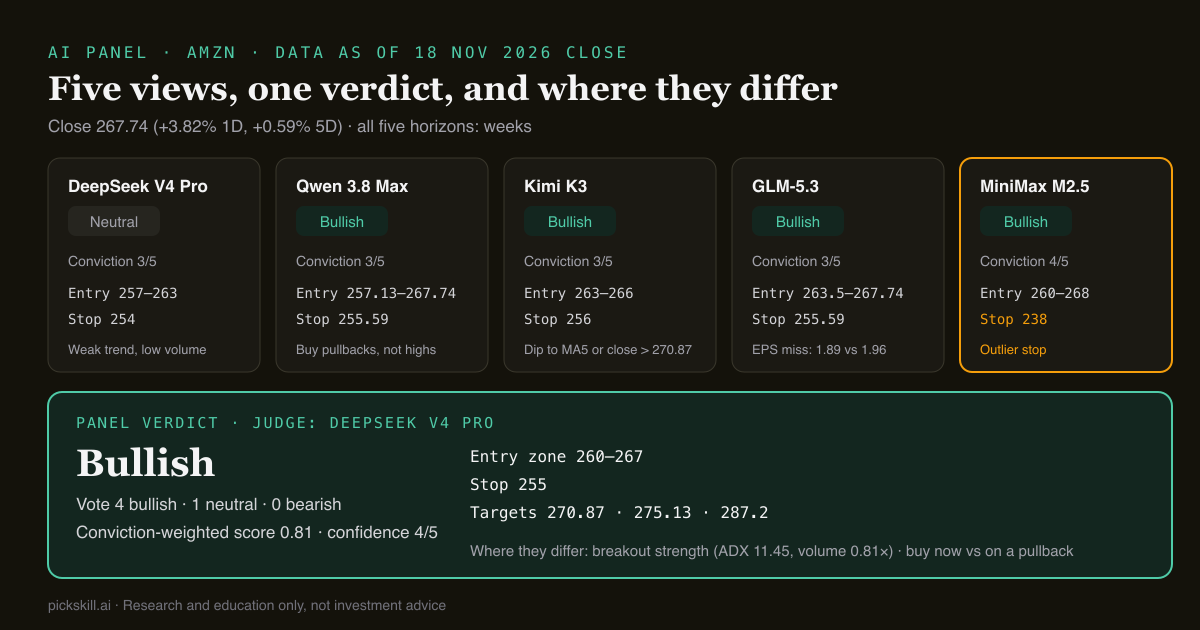
On data as of the 18 Nov 2026 close, the panel came back 4 bullish and 1 neutral on Amazon, with a conviction-weighted score of 0.81 and a verdict of bullish at confidence 4. AMZN closed at 267.74, up 3.82% on the day and 0.59% over five days. The models agreed on the core facts: the close sat above the 5-, 20- and 60-day moving averages (263.5, 257.13 and 255.59), MACD had just turned bullish that day, and the nearest resistance was the 60-day high close of 270.87 and the upper Bollinger Band at 275.13. All five chose a horizon of weeks. Where they split shows up in their levels.
| Model | Stance | Conviction | Entry zone | Stop |
|---|---|---|---|---|
| DeepSeek V4 Pro | Neutral | 3 | 257–263 | 254 |
| Qwen 3.8 Max | Bullish | 3 | 257.13–267.74 | 255.59 |
| Kimi K3 | Bullish | 3 | 263–266 | 256 |
| GLM-5.3 | Bullish | 3 | 263.5–267.74 | 255.59 |
| MiniMax M2.5 | Bullish | 4 | 260–268 | 238 |
| Panel verdict | Bullish | 4 (confidence) | 260–267 | 255 |
The judge listed two disagreements. First, DeepSeek V4 Pro stayed neutral because trend strength was weak (ADX 11.45) and volume did not confirm the move (0.81 times the 20-day average), while the other four accepted the breakout structure. Second, most models preferred to wait for a pullback to the 5- or 20-day average rather than buy near resistance. The table adds a third the summary does not spell out: MiniMax M2.5 placed its stop at 238, far below the 254 to 256 cluster the other four chose. Several models also flagged the same risk: the latest quarter's EPS of 1.89 came in below the 1.96 estimate, a 3.57% miss.
How do you check the disagreements against the data?
You check disagreements by turning each one into a question that a specific number can answer, then looking that number up yourself. For AMZN, the questions are: is the trend really weak, did volume confirm, and how much does the earnings miss matter. The "Signal page" link in the panel header opens /stocks/amzn, which shows all eight indicator dimensions with a 5-day trail, so you can see whether MACD's bullish turn is one day old or has held, and whether ADX and volume agree. For the earnings point, go to the primary source: Amazon's quarterly reports are on SEC EDGAR, where the latest 10-Q was filed on 30 Oct 2026. Use this checklist for any stock:
| What to check | Where in PickSkill | AMZN, 18 Nov 2026 |
|---|---|---|
| Do the models agree on direction? | Panel verdict: Vote and Conviction-weighted | 4 bullish, 1 neutral, score 0.81 |
| What exactly do they dispute? | Verdict: "Where they differ" | Breakout strength; buy now vs on a pullback |
| Is the signal fresh or confirmed? | Signal page, 5-day trail per dimension | MACD turned bullish that day |
| Is the trend strong? | Signal page: ADX/DMI | ADX 11.45, weak trend |
| Did volume and money flow confirm? | Signal page: volume and money flow | Volume 0.81× the 20-day average |
| Do the fundamentals back it? | Model "Risks" + the company's filings | EPS 1.89 vs 1.96 estimate |
| Where is each model wrong? | Model "Strategy": stop / invalidation | Stops from 238 to 256 |
Background: what money flow measures and how support and resistance work.
How do you stress-test the risks with an AI analyst?
You stress-test the risks by taking the strongest argument against your thesis to a conversational AI analyst and asking it to argue that side. The panel gives each model a few lines; the AI analyst in /chat can pull fundamentals, earnings, news and signals and go deeper, as one normal conversation on your plan. Good prompts are narrow and falsifiable: "AMZN's last quarter missed the EPS estimate by 3.57%. What drove the miss, and is it likely to repeat next quarter?" or "ADX is 11.45 on AMZN. How often does a MACD bullish turn fail when the trend is this weak, and what would confirm it?" Ask it what would change its mind. If the bear case survives, size for it or wait; if it collapses on the data, you learned something the panel alone could not show.
How do you decide your own levels?
You decide your own levels by comparing three things: the price that invalidates your thesis, the levels the models chose and the structure on the chart. In the AMZN run, four of five stops cluster at 254 to 256, just under the 60-day average of 255.59, and the combined strategy uses 255. That cluster tells you where a "trend still intact" reading breaks. MiniMax M2.5's 238 sits below the 60-day low of 240.35 and implies a much wider risk budget for the same trade. Neither is right in the abstract: your stop should match your thesis, horizon and position size. Write your entry, stop and first target, and note which model levels you used and why.
How should you keep a log of AI second opinions?
You keep a log by saving, for each idea, your original thesis, the panel's verdict and disagreements, your decision and the date, then checking back when price reaches a level. PickSkill saves every finished panel in the sidebar history with a "Panel" tag, so you can reopen the full result later at no cost; your own notes can live next to the stock in a watchlist built with clear rules. Over a few months the log shows what a single run cannot: whether unanimous panels served you better than split ones and which disagreements mattered. Be honest about sample size: 11 runs, as in our own log, is an anecdote, not a track record.
This article is for research and education only and is not investment advice. Data is as of the 18 Nov 2026 close unless stated otherwise.
FAQ
Can I use AI to check my stock idea? Yes, if you use it as a reviewer rather than a decision maker. Write your thesis first, then ask several AI models to analyse the same dated data, and focus on where they disagree with you and with each other. Check those points against the stock's signals and the company's filings before you change anything.
Why ask five AI models instead of one? One model can be confidently wrong. Five models reading the same fact sheet show which conclusions are robust and which depend on judgement. In 11 PickSkill AI Panel runs from 17 to 19 Nov 2026, the models agreed on a single stance only 3 times.
How much does the PickSkill AI Panel cost? The AI Panel has its own monthly quota: 1 run on Free, 10 on Starter, 50 on Pro and 200 on Power. A stock that has already been analysed that day loads instantly without using a run, and every finished panel stays in your history to reopen at no cost.
Should I follow the AI Panel's entry, stop and targets? No. The levels are reference points from models that do not know your horizon, position size or other holdings. Use them to see where the models think a thesis breaks, then set your own entry, stop and targets and note why.
What markets does the AI Panel cover? Any US, Hong Kong, China A-share, Japanese or Korean stock. You can search by ticker, company name or pinyin, or open the panel from a stock's signal page.