Daily vs Weekly Chart Signals: Which Wins?
When daily and weekly charts disagree, the weekly sets direction and the daily sets timing. The 4 combinations, Elder's Triple Screen and 4 real stocks.
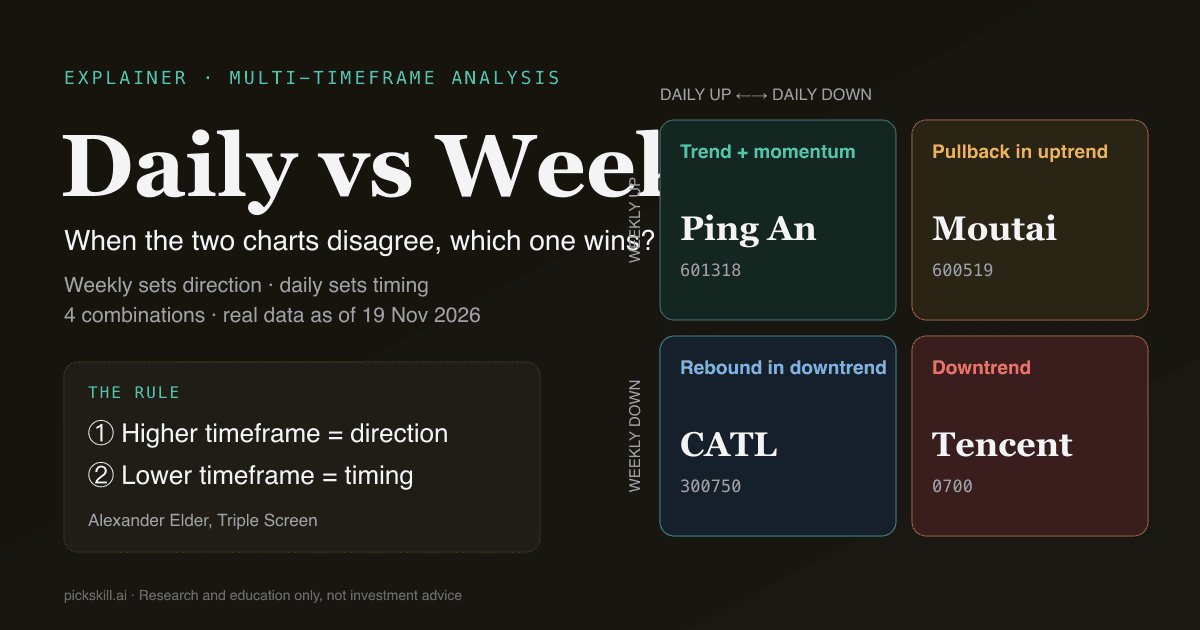
When the daily and weekly charts disagree, most multi-timeframe methods side with the weekly: the weekly chart decides direction, the daily chart decides timing. Multi-timeframe analysis is the practice of reading the same stock on two or more timeframes, using the longer one for trend and the shorter one for entries; its best-known form is Alexander Elder's Triple Screen system. As of the 19 Nov 2026 close, Tencent (0700.HK) finished at HK$348.40, 18.8% below its 20-week moving average, versus 10.7% below a week earlier — so any daily bounce there is, by this rule, a rebound inside a weekly downtrend until proven otherwise.
Daily-versus-weekly conflict is a classic chart-reading problem: the daily MACD has just crossed bullish while the weekly is still bearish below zero, or the weekly keeps climbing while the daily drops three days in a row. Below: what a weekly bar is, a four-combination table that answers "which one wins", and four real stocks from Shanghai, Shenzhen and Hong Kong placed into those boxes.
Key takeaways
- Weekly sets direction, daily sets timing. The rule comes from Alexander Elder's Triple Screen, which pairs timeframes roughly five times apart (one week ≈ five trading days).
- Four combinations: weekly up + daily up = trend with momentum; weekly up + daily down = pullback; weekly down + daily up = rebound; both down = downtrend. Only the middle two are real conflicts.
- Real examples as of 19 Nov 2026: Ping An (601318) is weekly up / daily up, but both margins are thin; Moutai (600519) is weekly up / daily MACD bearish while price holds above its daily MA20; CATL (300750) is weekly down / daily MACD bullish while price stays below its daily MA20; Tencent (0700) is down on both.
- A weekly bar is not final until the week's last close. Tencent was already down 9.9% from the prior Friday by Thursday, so mid-week weekly readings can swing hard.
- A-share price limits distort daily bars: 10% on the main boards, 20% on ChiNext; weekly bars absorb this better.
- Research and education only — none of this is a recommendation to buy or sell.
What is a weekly bar, and how is it different from a daily bar?
A weekly bar (weekly candle) compresses one week of trading into a single candle: the open is the first session's open, the close is the last session's close (usually Friday), and the high and low are the week's extremes. A daily bar is one session. Because a weekly bar holds about five daily bars, the "same" 20-period moving average means very different things: a daily MA20 is roughly one month of average cost, while a weekly MA20 covers 20 weeks — close to five months.
So the two charts are answering different questions. Daily bars react to news, sentiment and short-term flows, which means more signals and more noise. Weekly bars filter most of that out, which means fewer, later signals that better describe the intermediate trend. The indicator math does not change — you just feed weekly closes instead of daily closes. If moving averages or MACD are new to you, start with What Is a Moving Average? and What Is MACD?.
| Daily bar | Weekly bar | |
|---|---|---|
| One bar represents | 1 session | 1 week (~5 sessions) |
| MA20 covers | ~1 month | ~5 months |
| Signal frequency | High, more false signals | Low, noticeable lag |
| Best question it answers | When to act, where the stop goes | Is the trend up or down? |
| When the bar is final | That day's close | The week's last close |
| Hit by A-share price limits | Heavily (one-day cap) | Less (spread over a week) |
When daily and weekly signals conflict, which one should you follow?
The standard rule is "the higher timeframe sets direction, the lower timeframe sets timing": read the weekly trend first, look for daily setups only in that direction, and treat a daily signal that opposes the weekly as a pullback or a rebound rather than a new trend. The best-known source is Alexander Elder's Triple Screen trading system, which has its own chapter in his 1993 book Trading for a Living (Wiley); the book says the system was first presented in Futures magazine in April 1986.
The logic of the three screens: screen one uses the weekly chart (Elder used the slope of the weekly MACD histogram) to find the "tide" and only trades in its direction. Screen two drops to the daily chart and looks for "waves" against the tide — daily pullbacks in a weekly uptrend, daily rallies in a weekly downtrend. Screen three is the entry technique. Elder also describes a "factor of five": each timeframe relates to the next one up or down by roughly five, which is exactly the weekly-to-daily ratio.
Following the weekly does not mean ignoring the daily. The weekly tells you which side has better odds; the daily tells you whether the current price is a reasonable place to act. When both agree, the signal is cleanest. When they disagree, the classic mistake is reading a short daily bounce as a trend reversal.
What do the four daily–weekly combinations mean?
Cross weekly direction (up / down) with daily direction (up / down) and you get four boxes. The table gives the usual reading for each and what to check before concluding anything.
| Combination | Usual reading | What to check |
|---|---|---|
| Weekly up + daily up | Trend with momentum; both timeframes aligned | How far price has stretched above its averages (chasing risk); whether volume confirms |
| Weekly up + daily down | Pullback inside an uptrend | Does the pullback hold the daily or weekly MA20? Is volume shrinking? Is weekly MACD still above zero? |
| Weekly down + daily up | Rebound inside a downtrend | Can the rebound reclaim the daily MA20? Is the weekly MACD histogram narrowing? Is the bounce on rising volume? |
| Weekly down + daily down | Downtrend; the weakest box | Oversold readings and bullish divergence; is the drop a panic flush or steady distribution? |
The middle two rows are what traders call "daily–weekly divergence". That is a different thing from price–indicator divergence, where price and MACD disagree on the same timeframe.
How do you place a real stock into one of the four boxes?
This post uses a simple, reproducible rule. Weekly direction: weekly close versus weekly MA20, plus weekly MACD DIF versus DEA; both must agree for a clear call. Daily direction: daily MACD DIF above or below DEA, with the daily MA20 as a second check. Weekly bars were built from Yahoo Finance daily closes grouped by calendar week and computed in Python; daily readings come from PickSkill stock pages, cross-checked against our own calculation (MA20 matched exactly; MACD differed by about 0.1 because of the EMA start point).
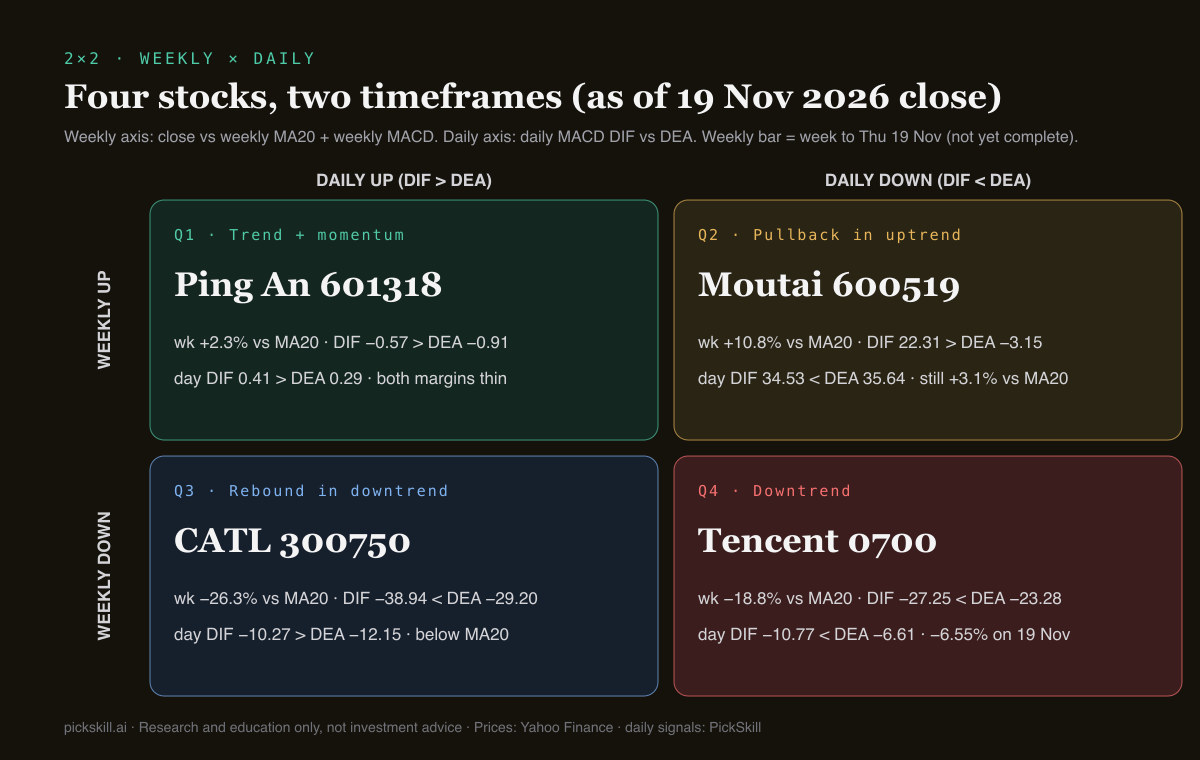
| Stock | Weekly close vs weekly MA20 | Weekly DIF / DEA | Daily DIF / DEA | Daily close vs daily MA20 | Box |
|---|---|---|---|---|---|
| Ping An 601318 | 54.66 vs 53.43 (+2.3%) | −0.57 / −0.91 | 0.41 / 0.29 | 54.66 vs 53.67 | Weekly up, daily up |
| Moutai 600519 | 1460.21 vs 1317.64 (+10.8%) | 22.31 / −3.15 | 34.53 / 35.64 | 1460.21 vs 1416.73 | Weekly up, daily down |
| CATL 300750 | 234.58 vs 318.43 (−26.3%) | −38.94 / −29.20 | −10.27 / −12.15 | 234.58 vs 241.90 | Weekly down, daily up |
| Tencent 0700 | 348.40 vs 428.88 (−18.8%) | −27.25 / −23.28 | −10.77 / −6.61 | 348.40 vs 393.32 | Weekly down, daily down |
As of the 19 Nov 2026 close. Prices in CNY (A-shares) and HKD (Tencent). The weekly bar is the unfinished week through Thursday 19 Nov; using the last complete week (to 13 Nov) instead gives the same box for all four stocks.
Ping An: weekly up, daily up — but thin on both. The weekly close is only 2.3% above the weekly MA20, and although weekly DIF is above DEA, both are still below zero. Daily DIF leads DEA by just 0.12; the PickSkill page shows moving averages as "tangled" and ADX at 15.3, "no trend". A box tells you direction, not strength.
Moutai: weekly up, daily down — a pullback, or more precisely a cool-off. Weekly DIF of 22.31 sits above zero and above DEA, with the close 10.8% above the weekly MA20. The daily MACD crossed bearish on 12 Nov, yet price is still 3.1% above the daily MA20, PickSkill shows the moving averages in bullish alignment and ADX at 37.1 in an uptrend. In Triple Screen terms, the tide is unchanged and the daily wave is cooling; the thing to watch is whether the daily MA20 holds.
CATL: weekly down, daily up — a rebound attempt in a downtrend. Price is 26.3% below the weekly MA20 and weekly DIF is under DEA. The daily MACD crossed bullish below zero on 2 Nov, but price remains below the daily MA20 (241.90), and on 19 Nov PickSkill's moving-average read flipped to bearish alignment. A daily-only reader sees "MACD golden cross"; the weekly says this is a bounce inside a larger decline that has not even reclaimed its daily average.
Tencent: weekly down, daily down. Weekly MACD crossed bearish in the week ending 23 Oct, daily MACD crossed bearish on 17 Nov, and on 19 Nov the stock fell 6.55% and closed below its lower Bollinger Band. Daily RSI is 27.9, oversold, and PickSkill scores RSI as bullish ("oversold bounce") — exactly the kind of lone daily signal the weekly filter exists for. Until the weekly shows any stabilisation, a daily oversold reading is more likely a pause than a turn.
What are the common pitfalls of reading weekly charts?
Weekly charts are steadier, but they have their own traps. These four are the most overlooked — especially the second.
- Weekly lag. A weekly MA20 spans about five months, so a genuine turn can take weeks to confirm. CATL peaked at 460.00 on 6 May 2026, and its weekly MACD had already crossed bearish in the week ending 5 Jun, but the slide continued for months. Confirmation comes late, and you pay for it in distance.
- A weekly bar is not complete until the week's last close. Tencent closed the prior Friday (13 Nov) at HK$386.60, 10.7% below its weekly MA20; by Thursday's close at 348.40 it was 18.8% below. Mid-week, you are looking at half a candle. Wait for the weekly close before trusting a weekly crossover.
- A-share price limits distort daily bars. Ordinary main-board stocks in Shanghai and Shenzhen have a 10% daily limit and ChiNext stocks 20% (Cailian Press, 10 Jul 2023). On a locked limit-up or limit-down day, the daily bar cannot show true supply and demand, and daily indicators get squashed; the weekly bar spreads it out. CATL is on ChiNext, so its limit is 20%. Hong Kong has no daily limit, so a 6%+ drop like Tencent's shows up in full.
- Treating two timeframes as two votes. Daily and weekly bars are built from the same prices, so they are not independent evidence. Agreement tells you the trend is consistent, not that you have double confirmation. Signal persistence is a better second check — see 5-Day Signal Trail: Why Today's Indicator Lies.
Checklist: what order should you check things in when daily and weekly disagree?
Turn the above into a fixed routine and run it every time the daily says one thing and the weekly another:
- Set the weekly direction. Weekly close above or below the weekly MA20? Weekly MACD DIF above or below DEA, and above or below zero? Only call a direction when they agree.
- Check whether the weekly bar is complete. If today is not the week's last session, treat weekly readings as provisional.
- Place the daily. Same direction as the weekly: trend continuation. Opposite: treat it as a pullback or a rebound, not a new trend.
- Check the key level. A pullback should hold the daily MA20; a rebound needs to reclaim it.
- Check daily persistence. Single-day crossovers and oversold readings flip often; look at the last 3–5 days.
- Discount limit-locked and suspended days on A-shares.
- Write down the call and what would invalidate it, e.g. "weekly up, daily pulling back; reassess on a close below the daily MA20".
To speed up steps 3–5, a PickSkill stock page shows daily signals across eight dimensions — MACD, moving averages, RSI, KDJ, Bollinger Bands, ADX, volume and money flow — each with a 5-day trail; definitions are on the indicators page. PickSkill's signals are daily, so you still switch your charting tool to weekly bars for step 1. For how to confirm a weekly MACD golden cross itself, read the weekly MACD golden cross guide.
All figures here illustrate a method; this post is for research and education only, not investment advice.
FAQ
Daily MACD golden cross but weekly death cross — which one wins? Most multi-timeframe methods give priority to the weekly. A weekly bearish cross means intermediate momentum is down, so a daily bullish cross is more likely a rebound inside a downtrend than a new uptrend. Watch whether the daily rally reclaims the daily MA20 and whether the weekly MACD histogram starts to narrow; until the weekly improves, treat the daily cross as a weak signal.
How do you use the weekly chart for trend and the daily chart for entries? Use the weekly MA20 and weekly MACD to set direction. In a weekly uptrend, look for daily pullbacks; in a weekly downtrend, treat daily rallies as a risk flag rather than an entry. That is the first two screens of Elder's Triple Screen. Position sizing and stop placement still have to be decided separately.
When is a weekly candle confirmed? A weekly candle is final only after the last session of the week closes — usually Friday, or the last trading day before a holiday. Before that, weekly indicators move with every daily close. Tencent, for example, was 10.7% below its weekly MA20 at the 13 Nov 2026 weekly close and 18.8% below by 19 Nov.
Can you pair other timeframes besides daily and weekly? Yes. Elder's factor-of-five idea suggests timeframes roughly five times apart, so monthly with weekly and daily with hourly are also common pairs. The key is to pick one pair and keep using it — higher for direction, lower for timing — rather than switching timeframes when a signal is inconvenient.