Golden Cross Stocks in Japan: How to Find Them
How to find golden cross stocks in Japan: 5/25 vs 50/200-day crosses, Kabutan and broker screeners, four confirmation filters, live data on 6 TSE large caps.
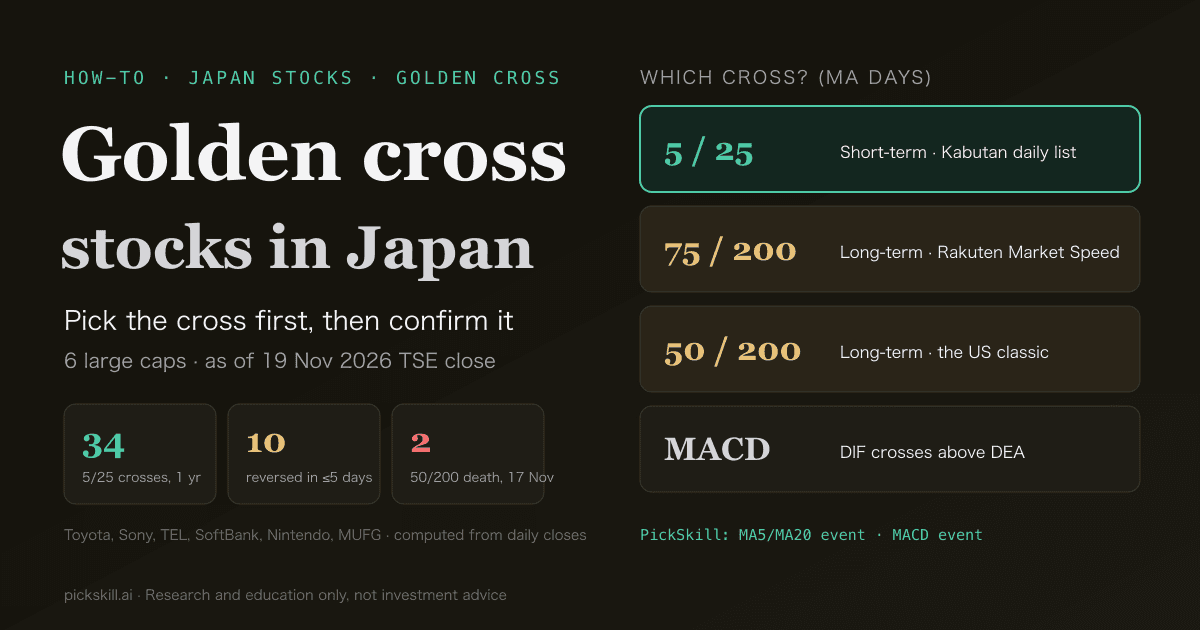
To find golden cross stocks in Japan, first decide which cross you mean — the 5/25-day pair most Japanese investors watch, a long-term 75/200 or 50/200-day cross, or MACD — then pull the day's crosses from a list or screener and confirm them with volume, distance from the 25-day line, ADX and the weekly chart. A golden cross is a short-term moving average crossing above a longer-term one, read as a sign the trend may be turning up. Across six Tokyo large caps (Toyota, Sony, Tokyo Electron, SoftBank Group, Nintendo and MUFG), PickSkill counted 34 golden crosses on the 5/25-day pair between 20 Nov 2025 and 19 Nov 2026 — and 10 of them flipped back to a death cross within five trading days.
So a list of "stocks that crossed today" is a starting point, not a shortlist. This guide covers the cross definitions Japanese tools actually use, the usual ways Japanese investors screen for them, the filters that weed out false signals, and what PickSkill can and cannot do for Japanese stocks today. For a market-agnostic walkthrough, see how to screen stocks for a golden cross in 60 seconds.
Key takeaways
- Pick the cross first. In Japan the 5/25-day pair is the short-term default; Kabutan's daily list uses it. Rakuten Securities' Market Speed defines its "golden cross" as 75/200-day and a "mini golden cross" as 25/75-day.
- Short crosses are frequent and noisy. 34 golden crosses on the 5/25-day pair in a year across six stocks; 10 reversed within five sessions.
- Confirm with four filters: rising volume, a 25-day deviation that is not stretched, a trending ADX, and a weekly chart pointing the same way.
- As of 19 Nov 2026: Toyota, Sony and Nintendo have the 5-day MA above the 25-day; Tokyo Electron and SoftBank Group both printed a 50/200-day death cross on 17 Nov.
- PickSkill's coverage: the screener covers US, Hong Kong and China A-shares (about 950 stocks) and does not include Japan yet. Japanese stocks have signal pages and AI Panel support.
Which golden cross do Japanese investors use?
"Golden cross" (ゴールデンクロス) in Japan usually means something shorter than the 50/200-day signal US readers know. The most visible daily source is Kabutan's "本日の【ゴールデンクロス/デッドクロス】" report; its 18 September 2026 edition lists stocks whose 5-day and 25-day moving averages crossed on a closing basis — 274 golden crosses and 37 death crosses that day. Rakuten Securities' Market Speed help page uses longer windows: a golden cross is the 75-day MA rising above the 200-day within the last six days, and a "mini golden cross" is the 25-day above the 75-day. The 50/200-day version is explained in Golden Cross vs Death Cross; the averages themselves in What Is a Moving Average?.
| Cross | Typical use | Frequency, six TSE large caps | Where to find it |
|---|---|---|---|
| 5/25-day | Short-term turn (days to weeks) | 34 golden crosses in 1 year; 10 reversed within 5 sessions | Kabutan daily list, broker charts |
| 25/75-day | Medium-term turn (Rakuten's "mini golden cross") | 10 golden crosses in 1 year | Rakuten Market Speed |
| 75/200-day | Long-term turn (Rakuten's definition) | 4 since Sep 2025 (latest: Nintendo, 11 Nov 2026) | Rakuten Market Speed |
| 50/200-day | Long-term turn (US convention) | 4 since Sep 2025 (latest: Nintendo, 21 Oct 2026) | Global charting tools |
| MACD | Momentum turn (DIF crosses above DEA) | Usually earlier than MA crosses | Charts; PickSkill screener for US/HK/A-shares |
Counts computed by PickSkill from Yahoo Finance daily closes (simple moving averages) through the 19 Nov 2026 close. 5/25 and 25/75: 20 Nov 2025–19 Nov 2026. Pairs using the 200-day: from 11 Sep 2025, when 200 sessions of data were available.
Where do Japan's big names stand on 19 November 2026?
At the 19 Nov 2026 Tokyo close, three of the six stocks had their 5-day average above the 25-day: Toyota, Sony and Nintendo. None crossed that day — their latest golden crosses were in October (Toyota 16 Oct, Sony 9 Oct, Nintendo 15 Oct). MUFG shows the failure mode: a 5/25-day golden cross on 13 Nov reversed into a death cross on 18 Nov, three sessions later. On the long-term 50/200-day pair, Tokyo Electron and SoftBank Group both printed death crosses on 17 Nov, while Nintendo crossed up on 21 Oct. None of this is a recommendation; it is a record of the calculation.
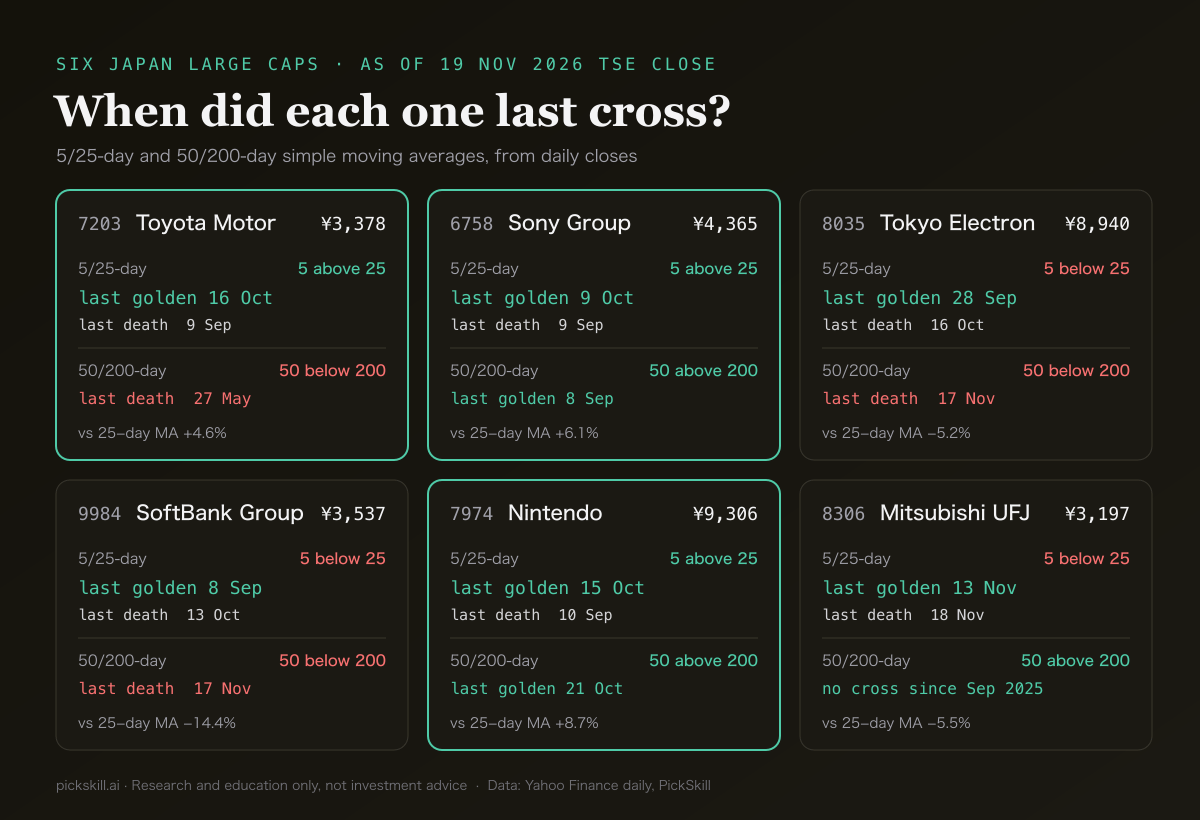
| Stock | Close | 5/25-day (latest cross) | 50/200-day (latest cross) | vs 25-day MA | PickSkill MA signal |
|---|---|---|---|---|---|
| Toyota (7203) | ¥3,378 | Above · golden 16 Oct | Below · death 27 May | +4.6% | Neutral (tangled) |
| Sony (6758) | ¥4,365 | Above · golden 9 Oct | Above · golden 8 Sep | +6.1% | Bullish (aligned up) |
| Tokyo Electron (8035) | ¥8,940 | Below · death 16 Oct | Below · death 17 Nov | −5.2% | Neutral |
| SoftBank Group (9984) | ¥3,537 | Below · death 13 Oct | Below · death 17 Nov | −14.4% | Neutral (bearish 4 prior days) |
| Nintendo (7974) | ¥9,306 | Above · golden 15 Oct | Above · golden 21 Oct | +8.7% | Bullish (5 days) |
| MUFG (8306) | ¥3,197 | Below · golden 13 Nov → death 18 Nov | Above · no cross since Sep 2025 | −5.5% | Bearish (aligned down) |
Source: cross dates and 25-day deviation computed by PickSkill from Yahoo Finance daily closes; MA signal from each PickSkill stock page (based on 5/20/60-day MAs). All as of the 19 Nov 2026 close.
How do Japanese investors usually screen for golden crosses?
Japanese retail investors tend to use one of three routes. The quickest is a daily list such as Kabutan's, published after the close with counts of 5/25-day golden and death crosses — the answer to "which stocks crossed today". The second is a broker screener: Rakuten's Market Speed can pull stocks matching its 75/200-day and 25/75-day cross definitions, and SBI Securities' domestic stock screener, per its help page, has a "technical" tab among its detailed conditions and lets users save up to six condition sets. The third is a charting tool like TradingView, where you set any moving-average pair yourself, such as 50/200-day. Every route returns the same thing: the fact that a cross happened. Whether the move continues needs separate confirmation.
Which filters cut golden cross false signals?
The way to cut false signals is to check what supports the cross, not the cross itself. A moving average is just an average of past closes, so a stock drifting sideways can cross its short and long averages again and again — MUFG's three-day reversal and the 10-of-34 failure rate above show it. Four filters cover most of the noise. The same logic for MACD crosses is in How to Confirm a MACD Golden Cross, and volume is covered in What Is Volume Analysis?.
- Volume. Look for volume at least 1.2× its 20-day average on the cross. On 19 Nov Nintendo traded at 1.40×, Toyota at 0.67× (PickSkill stock pages). A cross on light volume says little about real buying.
- 25-day deviation (乖離率). A cross that arrives with price far above the 25-day line may come after most of the move. Nintendo sat 8.7% above its 25-day MA on 19 Nov, after an 8.7% five-day gain.
- ADX. ADX above 20–25 with +DI above −DI means the up-move has strength. Sony read ADX 40.5 with +DI 27.4 over −DI 9.7; Nintendo's ADX of 15.9 counts as no trend.
- Weekly direction. Check the cross isn't fighting a falling long-term trend. Toyota's 5-day sits above its 25-day, yet its 50-day has been below its 200-day since a 27 May death cross.
How do you find golden cross stocks with PickSkill?
How you do it in PickSkill depends on the market. The signal screener covers about 950 US, Hong Kong and China A-share stocks — S&P 500, Nasdaq-100, Hang Seng and CSI 300 members plus other stocks with a page — and does not include Japanese stocks yet. So Japanese names are checked one by one on their signal pages, while US, HK and A-shares can be screened in bulk. Note that PickSkill's moving-average event is the MA5/MA20 cross, slightly shorter than Japan's usual 25-day line. Here is the screen run on US stocks at the 18 Nov 2026 close.
- Pick the market. Choose US stocks (526 screened that day).
- Add the event. "MA5/MA20 golden cross within 3 days" matched 10 stocks: AES, Dexcom, Generac, C.H. Robinson, Meta, CoreWeave, Elevance Health, Intuit, Loews and Targa Resources.
- Drop the ones that already reversed. CoreWeave, Intuit and Loews had their 5-day average back below the 20-day by 18 Nov (CoreWeave: MA5 $51.47, MA20 $53.12).
- Require volume. Adding "volume ratio ≥ 1.2" left 5: AES, Generac, C.H. Robinson, Elevance Health and Loews.
- Require a trend. Adding "ADX bullish" (ADX ≥ 20 and +DI above −DI) left only AES, with a 7.38× volume ratio and ADX 26.41. Volume seven times normal usually means news is driving the stock, so check the story first.
- For Japanese stocks, use the stock page. Open /stocks/7203-jp for Toyota to see all 8 indicators and the 5-day signal trail, then run the AI Panel for five models' views if you want a second opinion.
The screener is part of the Pro and Power plans; the Free plan shows the match count.
Should you use the 5/25-day or the 50/200-day cross?
The difference is the time horizon. The 5/25-day pair compares one week with roughly one month, so it reacts fast and suits traders looking for entries over days or weeks — at the cost of many more signals and more false ones. Across the six stocks, the 5/25-day pair produced 34 golden crosses in a year, while the 50/200-day pair produced 4 since September 2025 (Tokyo Electron 20 Oct 2025, SoftBank Group 18 May 2026, Sony 8 Sep 2026, Nintendo 21 Oct 2026). The slower cross is better at confirming a change in the long-term trend. A common combination is to use the 50/200 or 75/200-day pair for direction and act only on 5/25-day golden crosses that agree with it; on 19 Nov 2026 Sony and Nintendo met both.
FAQ
How do I find Japanese stocks that had a golden cross today? The fastest route is Kabutan's daily "本日の【ゴールデンクロス/デッドクロス】" report, published after the Tokyo close, which lists stocks whose 5-day and 25-day moving averages crossed, with counts. Broker screeners also work, but definitions differ: Rakuten's Market Speed, for example, uses 75/200-day for its golden cross.
What moving averages are used for golden crosses in Japan? Short-term, the 5-day and 25-day pair is the most common. For longer horizons Japanese tools use 25/75-day, 75/200-day, or the US-style 50/200-day pair. Rakuten Securities defines its golden cross as 75/200-day and its mini golden cross as 25/75-day. Choose the pair that matches how long you plan to hold.
Is a golden cross a buy signal on its own? No. In the six Japanese large caps above, 10 of 34 golden crosses on the 5/25-day pair reversed into death crosses within five trading days over the past year. Treat a cross as a reason to look closer, and confirm it with volume, 25-day deviation, ADX and the weekly trend before drawing conclusions.
Can PickSkill's screener search Japanese stocks? Not as of November 2026. The screener covers US, Hong Kong and China A-share stocks — about 950 names from the S&P 500, Nasdaq-100, Hang Seng and CSI 300. Japanese stocks such as Toyota, Sony and Tokyo Electron have individual signal pages with 8 indicators and a 5-day trail, and the AI Panel supports them.
This article is for research and education only, not investment advice. Data as of the 19 Nov 2026 Tokyo close (US stocks: 18 Nov 2026 close).