KOSPI Technical Analysis: Samsung, SK hynix & More
How to analyse Korean stocks with RSI, KDJ, Bollinger, ADX and volume, using real readings for six KOSPI large caps as of 19 Nov 2026.
KOSPI technical analysis is the practice of reading the index through its heavyweight stocks — Samsung Electronics, SK hynix and a handful of other large caps — using RSI, KDJ, Bollinger Bands, ADX and volume to judge whether the market is overheating or correcting. The KOSPI first closed above 6,000 on 25 February 2026, at 6,083.86 (The Korea Times), but by 17 November it had slipped to 4,968.48, a nine-month low (Korea JoongAng Daily). As of 19 November 2026, none of the six KOSPI large caps tracked below trips a single overheating flag.
This guide is for international investors who followed the Korean chip rally and want a repeatable way to read Korean stocks now. It covers the market rules that change how indicators behave in Seoul, then walks through PickSkill's eight indicators on six real stock pages.
Key takeaways
- The KOSPI went from its first close above 6,000 (6,083.86, 25 Feb 2026) to 7,822.24 (11 May), a record close of 9,114.55 (22 Jun, Yahoo Finance index data) and back down to 4,968.48 (17 Nov).
- As of 19 Nov 2026, Samsung Electronics' RSI(14) is 40.1 and SK hynix's is 41.4 — far from the overbought line at 70.
- None of the six stocks meets any overheating flag (RSI ≥ 70, KDJ above 80, close above the upper Bollinger Band, volume ≥ 1.5× average). The indicators describe a correction inside a downtrend, not a blow-off.
- LG Energy Solution sits closest to oversold (RSI 32.2, KDJ K 14.5), but ADX 38.2 with −DI on top says the downtrend is still strong.
- PickSkill's money-flow reading is a price × volume estimate. Check real foreign and institutional net buying on the KRX Data Marketplace.
How did the 2026 KOSPI rally unfold?
The 2026 KOSPI story is a chip-led surge followed by a sharp correction. On 25 February the index rose 114.22 points (1.91%) to 6,083.86, its first close above 6,000; The Korea Times credited semiconductors, with Samsung Electronics closing at 203,500 won and SK hynix at 1,018,000 won. The rally ran into May, and on 11 May the KOSPI closed at 7,822.24, a record at the time (The Korea Times). The second half was far choppier. On 28 October the index jumped 6.63% to 6,012.44, back above 6,000 for the first time in ten sessions (Herald Business). On 17 November it fell for a fourth straight day to 4,968.48, its lowest level in nine months, as foreigners sold a net 1.44 trillion won.
In a market like that, the index chart alone hides more than it shows. The KOSPI is market-cap weighted, so Samsung Electronics and SK hynix often decide its direction. Reading the large caps one by one is usually more precise than reading the index.
Which Korean market rules affect technical indicators?
Three features of the Korean market change how indicators should be read. First, the daily price limit: the Korea Exchange (KRX) caps daily moves at ±30% of the base price, a band in force since 15 June 2015 (KRX daily price limits). A stock pinned at its limit all day prints a bar where high equals low, which distorts RSI, KDJ and ADX; PickSkill forces those bars to neutral so they cannot create false signals. Second, trading hours: the regular session runs 09:00–15:30 KST, with orders accepted from 08:30 and after-hours sessions following (KRX trading hours). Daily indicators only settle after the 15:30 close — which, for readers in Europe or the US, lands before their own trading day starts. Third, investor-flow data: the KRX Data Marketplace publishes trading by investor type (foreign, institutional, individual) for the whole market and for individual stocks.
| Rule | Detail (source: KRX) | What it means for indicators |
|---|---|---|
| Daily price limit | ±30% of base price (since 15 Jun 2015) | Limit-locked bars (high = low) are masked as neutral on PickSkill |
| Regular session | 09:00–15:30 KST, orders from 08:30 | Read daily signals after the 15:30 close |
| After-hours | e.g. closing-price trading 15:40–16:00 | Not part of the regular-session daily bar |
| Investor flow data | Foreign / institutional / individual trading published | Cross-check against PickSkill's estimated flow |
The flow point matters most for foreign readers. Foreign investors frequently drive the KOSPI, so when PickSkill's estimated flow shows an outflow, checking whether KRX reports foreign net selling the same day tells you whether the signal has real money behind it. See what capital flow measures for how the proxy is built.
What are Samsung Electronics and SK hynix signalling now?
As of 19 November 2026, both chip leaders show a short-term bounce inside a downtrend. Samsung Electronics (005930) closed at 196,900 won (+1.13%) but is down 5.34% over five sessions, and its eight indicators read 1 bullish, 3 bearish, 4 neutral. A MACD golden cross is the only bullish reading. The moving averages are stacked downward (MA5 196,940 < MA20 209,685 < MA60 239,670), and ADX 22.6 with −DI 29.4 above +DI 19.8 reads bearish. RSI 40.1 and KDJ K 37.7 sit mid-range, and volume is 0.78× its 20-day average. SK hynix (000660) closed at 1,183,000 won (+3.41%), down 5.66% over five sessions, with 1 bullish, 2 bearish and 5 neutral. KDJ printed a golden cross near oversold (K 26.9, D 25.2), but ADX 24.7 with −DI 31.5 over +DI 18.9 still points down.
Neither stock is anywhere near overbought. For the moving-average side, our guide to the golden cross and death cross explains the 50/200-day version; KDJ vs RSI explains why the two oscillators can disagree, as they do on SK hynix today.
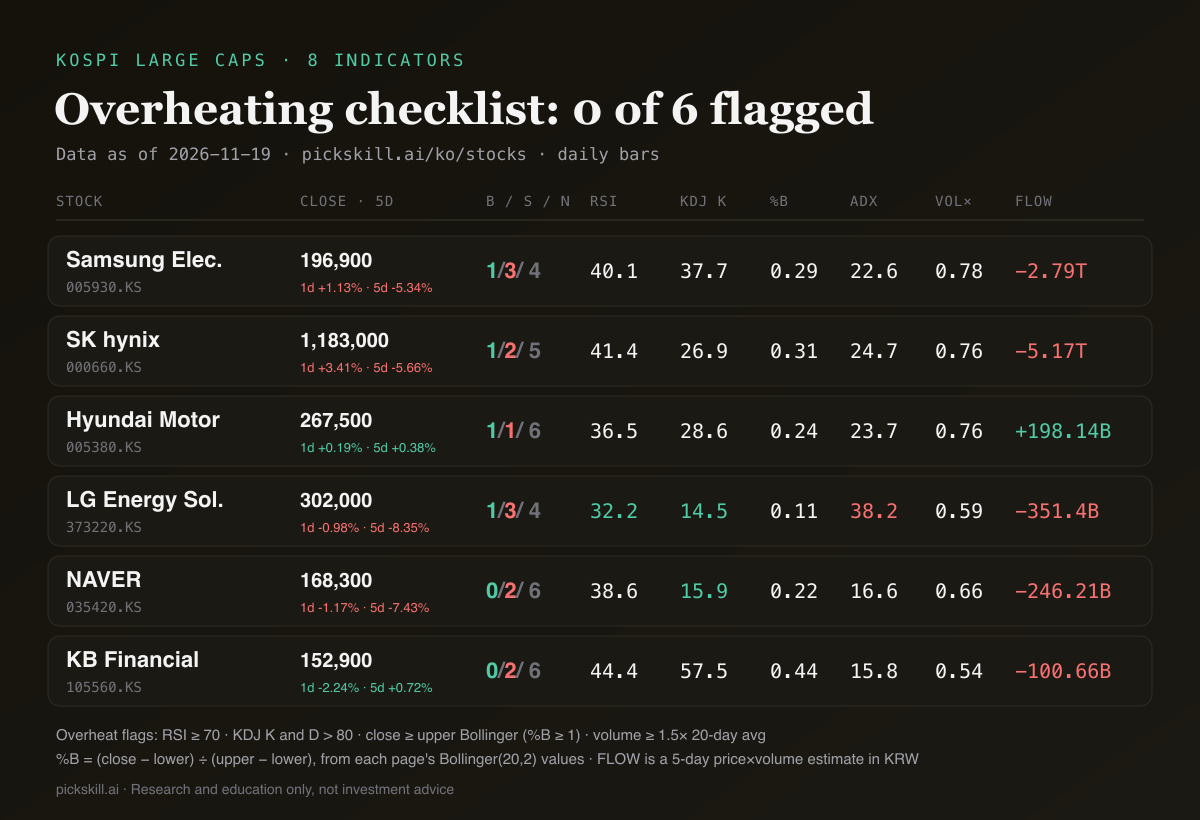
How do six KOSPI large caps compare on PickSkill's indicators?
Even on the same day in the same market, the indicator mix differs by stock. The table below uses 19 November 2026 data from PickSkill's Korean stock pages. B/S/N counts bullish, bearish and neutral readings across the eight indicators. %B is the close's position inside the Bollinger(20,2) band (0 = lower band, 1 = upper), calculated from the band values shown on each page.
| Stock | Close (KRW) | 5-day | B/S/N | RSI(14) | KDJ K/D | %B | ADX (+DI/−DI) | Vol / MA20 |
|---|---|---|---|---|---|---|---|---|
| Samsung Electronics | 196,900 | −5.34% | 1/3/4 | 40.1 | 37.7/38.5 | 0.29 | 22.6 (19.8/29.4) | 0.78× |
| SK hynix | 1,183,000 | −5.66% | 1/2/5 | 41.4 | 26.9/25.2 | 0.31 | 24.7 (18.9/31.5) | 0.76× |
| Hyundai Motor | 267,500 | +0.38% | 1/1/6 | 36.5 | 28.6/20.1 | 0.24 | 23.7 (20.6/26.3) | 0.76× |
| LG Energy Solution | 302,000 | −8.35% | 1/3/4 | 32.2 | 14.5/17.6 | 0.11 | 38.2 (7.8/31.4) | 0.59× |
| NAVER | 168,300 | −7.43% | 0/2/6 | 38.6 | 15.9/30.5 | 0.22 | 16.6 (21.3/27.5) | 0.66× |
| KB Financial | 152,900 | +0.72% | 0/2/6 | 44.4 | 57.5/62.8 | 0.44 | 15.8 (25.7/19.8) | 0.54× |
Three patterns stand out. All six trade on below-average volume (0.54× to 0.78×), so the recent bounces have little participation behind them — see volume analysis for why that matters. The four names with ADX above 20 (Samsung, SK hynix, Hyundai Motor, LG Energy Solution) all have −DI above +DI, meaning their downtrends are intact. NAVER and KB Financial have ADX below 20, which PickSkill classifies as no meaningful trend.
How do you check whether the KOSPI is overheating?
To check whether the KOSPI is overheating, look for several indicator families firing at once rather than any single reading: momentum (RSI, KDJ), price position (Bollinger Bands), trend strength (ADX) and participation (volume). Using the same thresholds PickSkill's signal engine applies, the checklist below has five steps. Three or more flags at the same time is worth taking seriously; one or two can simply be part of a strong trend. Apply it to the heavyweights first, since they move the index.
- RSI(14) at or above 70. PickSkill classifies this as bearish (mean-reversion pressure). In a chip rally RSI can stay above 70 for weeks, so never use it alone. Background: what RSI is.
- KDJ K and D both above 80, or a death cross with K above 50. KDJ reacts faster than RSI; a death cross at high levels is often the first sign of a short-term peak.
- Close at or above the upper Bollinger Band (%B ≥ 1). Riding the upper band is also a sign of strength, so watch whether price falls back inside. See Bollinger Bands.
- ADX at or above 25 with +DI over −DI, and ADX starting to roll over. The trend is strong but losing force. ADX below 20 means no real trend.
- Volume at least 1.5× its 20-day average. PickSkill counts heavy-volume up and down days over the last five sessions; heavy-volume down days near a high read as distribution.
Run against the six stocks on 19 November 2026, this checklist flags nothing. The mirror-image oversold checklist (RSI ≤ 30, KDJ K and D below 20, %B ≤ 0) comes closest to triggering on LG Energy Solution, whose KDJ (K 14.5, D 17.6) is in oversold territory. With ADX at 38.2 and −DI far above +DI, though, "oversold" here describes a strong downtrend, not a confirmed turn.
How do you run the AI Panel on a Korean stock?
The AI Panel has five AI models read the same fact sheet on one stock and give independent views, then a judge model combines them — and it supports Korean stocks. Open the AI Panel, search by ticker (for example 005930) or company name, and run it. DeepSeek V4 Pro, Qwen 3.8 Max, Kimi K3, GLM-5.3 and MiniMax M2.5 each read price action, the eight technical signals, valuation and the latest earnings, then return a stance, conviction from 1 to 5, a horizon, reasons, risks and a strategy with entry zone, stop and targets. DeepSeek V4 Pro then produces a conviction-weighted score between −1 and 1 and lists where the models agree and disagree. Every Korean stock page also has an "Ask the AI panel" button.
A practical order: read the eight indicators and the five-day signal trail on the stock page yourself first, then run the panel to see how five models interpret the same data. Where they disagree is where your own homework should go. The panel is long-only, so a bearish view means reduce or avoid, never short. Each new run uses one monthly AI Panel credit (Free includes 1, Pro 50), and a stock already analysed that day loads at no cost. More detail is on the AI Panel feature page.
FAQ
How do you analyse Korean stocks technically? Start with trend, then momentum, then confirmation. Check moving-average alignment and ADX for direction and strength, use RSI and KDJ for overbought or oversold readings, and confirm with volume and KRX foreign and institutional flow data. Because Samsung Electronics and SK hynix carry so much weight in the KOSPI, read their indicators before the index itself.
Is Samsung Electronics overbought right now? Not as of 19 November 2026. PickSkill's stock page shows Samsung Electronics with RSI(14) at 40.1 and KDJ K at 37.7, both mid-range, and a 1 bullish, 3 bearish, 4 neutral tally. The close of 196,900 won sat below its 20- and 60-day moving averages. Readings change daily, so check the live page.
How does Korea's ±30% price limit affect indicators? KRX caps daily moves at ±30% of the base price. A stock locked at its upper or lower limit all day prints a bar where high equals low, which carries no real information and can distort RSI, KDJ and ADX. PickSkill forces those bars to neutral, so limit days do not generate false golden crosses or overbought signals.
Is PickSkill's money flow the same as foreign net buying? No. PickSkill's flow reading is an estimate derived from price and volume, not order-book data. Actual net buying by foreign, institutional and individual investors is published by the Korea Exchange on its Data Marketplace. When the estimate and the KRX figures point the same way, the signal is more trustworthy.
What time should I read KOSPI signals from outside Korea? KRX's regular session closes at 15:30 KST, so the daily bar is final after that. That is 06:30 UTC, before European and US markets open. PickSkill's stock pages refresh every few hours from daily price data, so check the "data as of" date before relying on a reading.
Every figure here comes from PickSkill's Korean stock pages as of 19 November 2026 (daily bars, Yahoo Finance) and the articles and KRX pages linked above. Research and education only, not investment advice.