Free Cash Flow vs Net Income: Why They Differ
Why free cash flow differs from net income: the bridge, FCF conversion, red flags, and worked examples from Microsoft, Visa and Amazon 10-K filings.
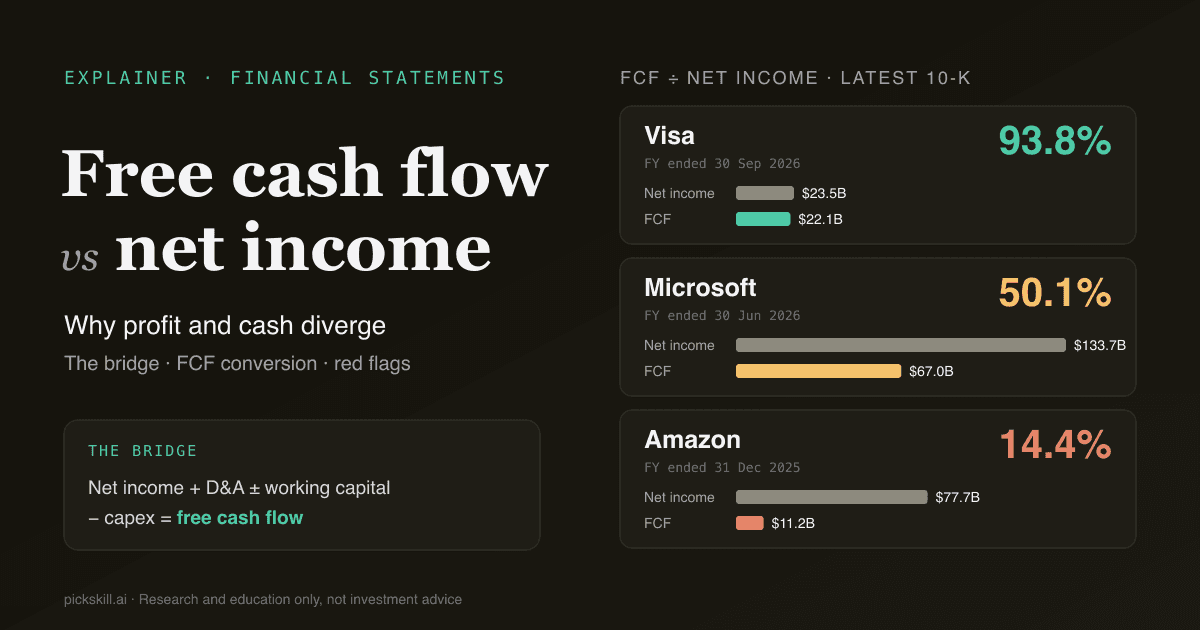
Free cash flow differs from net income because net income is an accrual measure of profit, while free cash flow is the cash actually left after running the business and paying for capital spending. Free cash flow vs net income is the comparison between those two numbers, and the gap is explained by a short bridge: add back non-cash charges such as depreciation, adjust for working capital, then subtract capex. In Microsoft's fiscal year ended 30 June 2026, $133.7 billion of net income turned into $67.0 billion of free cash flow, an FCF conversion of 50.1%, because capex reached $115.9 billion (Form 10-K filed 29 July 2026).
Neither number is "the real one". Net income matches revenue with the costs of earning it; free cash flow shows what owners could take out. Reading them side by side is a fast earnings-quality check.
Key takeaways
- The bridge: net income + depreciation & amortization + other non-cash items ± working capital changes = operating cash flow; operating cash flow − capex = free cash flow (FCF).
- FCF conversion = FCF ÷ net income. Latest 10-K figures: Visa 93.8%, Microsoft 50.1%, Amazon 14.4%.
- Low conversion is not automatically bad. Microsoft and Amazon are low because of record capex, which is visible and deliberate.
- The red flag is net income persistently above FCF without a capex explanation: rising receivables, inventory build-ups or non-cash gains doing the work.
- Stock-based compensation is added back as non-cash, which flatters FCF. Amazon's 2025 SBC ($19.5B) was larger than its FCF ($11.2B).
What is the difference between free cash flow and net income?
Net income is the bottom line of the income statement: revenue minus all expenses, interest and taxes, recorded when earned or incurred rather than when cash moves. It includes non-cash charges such as depreciation, which spreads the cost of a server or factory over its useful life, and it excludes the upfront cash cost of buying that asset. Free cash flow comes from the cash flow statement. It starts from operating cash flow, which strips out non-cash items and timing differences, then subtracts capital expenditures, the cash spent on property and equipment in the year. So net income answers "was the business profitable under accounting rules?" and FCF answers "how much cash did the business generate after reinvesting to maintain and grow itself?" For a full definition of FCF, including FCFF vs FCFE, see What Is Free Cash Flow?.
| Net income | Free cash flow | |
|---|---|---|
| Statement | Income statement | Cash flow statement (derived) |
| Basis | Accrual: revenue when earned, costs when incurred | Cash: money in and out during the period |
| Depreciation & amortization | Deducted as an expense | Added back (non-cash) |
| Capital expenditures | Not deducted directly (spread via depreciation) | Deducted in full when paid |
| Working capital (receivables, inventory, payables) | Ignored | Changes add or subtract cash |
| Stock-based compensation | Deducted as an expense | Usually added back (non-cash) |
| GAAP-defined? | Yes | No, it is a non-GAAP measure each company defines |
| Used for | EPS, P/E, return on equity | DCF valuation, dividends, buybacks, debt paydown |
How do you get from net income to free cash flow?
You walk down the operating section of the cash flow statement, which under the indirect method starts with net income and reconciles it to cash. There are four kinds of adjustments, then one subtraction:
- Start with net income (the same figure behind EPS).
- Add back depreciation and amortization. These were expenses in net income but no cash left the company this year.
- Add back other non-cash items: stock-based compensation, deferred taxes, and remove non-cash gains (for example, unrealized gains on investments that boosted net income).
- Adjust for working capital. Rising receivables or inventory consume cash (subtract); rising payables or unearned revenue supply cash (add). The result is operating cash flow.
- Subtract capital expenditures (purchases of property and equipment). What remains is free cash flow.
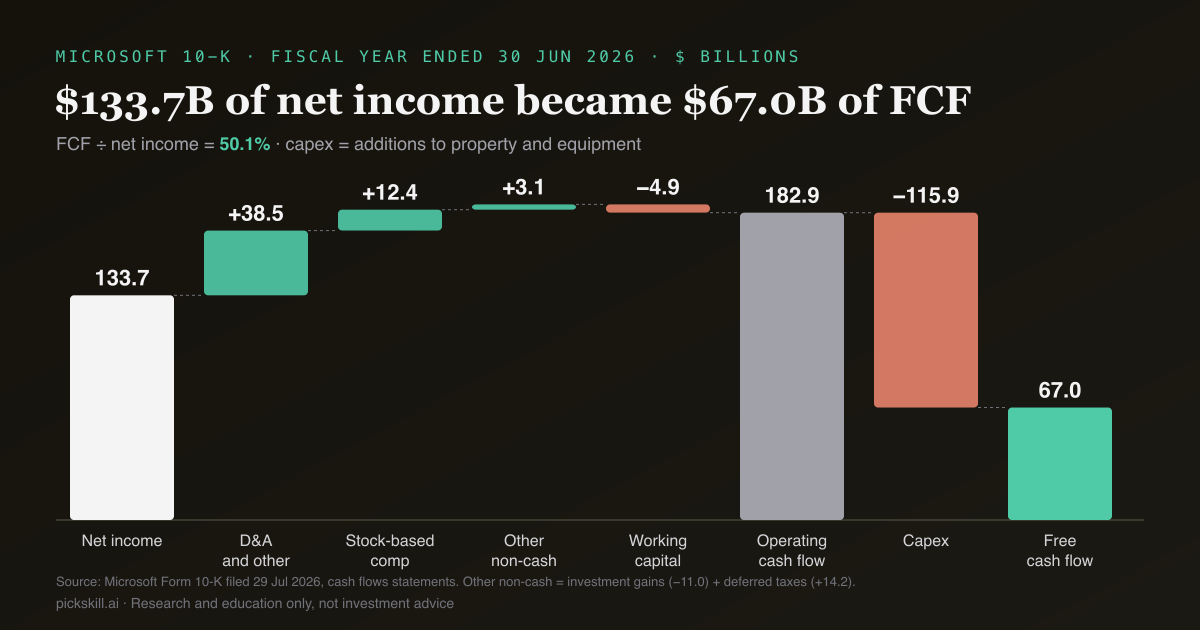
Microsoft's fiscal 2026 statement shows each step. Net income was $133,749 million. "Depreciation, amortization, and other" added $38,534 million and stock-based compensation $12,405 million. Investment gains of $11,047 million were removed and deferred taxes added $14,189 million, a net $3,142 million. Working capital absorbed $4,895 million, mostly a $12,737 million rise in receivables, partly offset by $9,361 million more unearned revenue. Operating cash flow came to $182,935 million; "additions to property and equipment" of $115,948 million left $66,987 million of FCF (Microsoft 10-K, cash flows statements).
What is FCF conversion and what is a good ratio?
FCF conversion is free cash flow divided by net income, expressed as a percentage. It tells you how much of each dollar of reported profit turned into spendable cash in the same period. Near or above 100% means profit is backed by cash: depreciation roughly covers capex, and working capital is not soaking up money. Well below 100% means something sits between profit and cash, and your job is to find out what. There is no universal "good" number: an asset-light payments network should convert close to 100%, while a company building data centres will convert far less during the build-out. Operating cash flow ÷ net income isolates accrual quality before capex, so we show both ratios below.
| Company (latest 10-K) | Net income | Operating cash flow | Capex | FCF | OCF ÷ NI | FCF ÷ NI |
|---|---|---|---|---|---|---|
| Visa, FY ended 30 Sep 2026 | $23,504M | $23,728M | $1,671M | $22,057M | 101.0% | 93.8% |
| Microsoft, FY ended 30 Jun 2026 | $133,749M | $182,935M | $115,948M | $66,987M | 136.8% | 50.1% |
| Amazon, FY ended 31 Dec 2025 | $77,670M | $139,514M | $128,320M* | $11,194M | 179.6% | 14.4% |
*Amazon's capex is "purchases of property and equipment, net of proceeds from sales and incentives" ($131,819M − $3,499M), the definition Amazon uses for its own FCF. Sources: Visa 10-K filed 5 Nov 2026, Microsoft 10-K filed 29 Jul 2026, Amazon 10-K filed 6 Feb 2026.
Notice that all three companies have operating cash flow at or above net income. Their accrual quality is fine; the differences come almost entirely from capex.
What do real filings show? Visa, Microsoft and Amazon
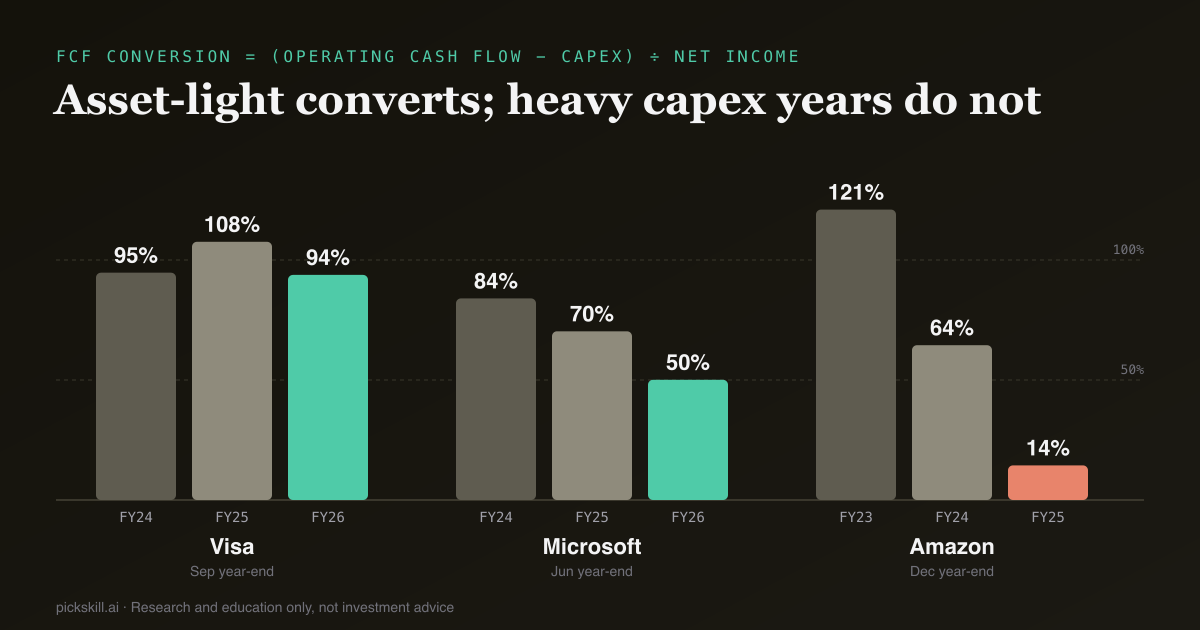
Visa (asset-light). Capex was $1,671 million on $45,903 million of net revenue, about 3.6% of revenue. FCF conversion was 94.7% in fiscal 2024, 107.6% in 2025 and 93.8% in 2026. The 2026 dip came largely from a $2,040 million outflow on accrued litigation, a working capital line, not from capex. Visa's bridge also has an unusual pair: client incentives of $18,317 million are added back as non-cash, and $17,705 million of incentive cash payments is subtracted in working capital, so they almost net out.
Microsoft (capex ramp). Conversion fell from 84.0% (FY2024) to 70.3% (FY2025) to 50.1% (FY2026), while net income rose 52% over those two years. Capex went from $44,477 million to $115,948 million, about 35% of $331,839 million revenue. This is FCF lagging profit because the company is buying long-lived assets whose cost reaches net income only gradually, through depreciation.
Amazon (heaviest capex). Conversion went from 121.0% in 2023 to 64.5% in 2024 and 14.4% in 2025. Amazon's own reconciliation in the 10-K shows FCF falling from $38,219 million to $11,194 million as net capex rose from $77,658 million to $128,320 million. Net income also included $14,880 million of non-operating income that was removed in the bridge, and stock-based compensation of $19,467 million was added back. Subtract SBC as if it were a cash cost and 2025 FCF would be negative (about −$8.3 billion).
Why does stock-based compensation matter for FCF?
Stock-based compensation (SBC) is a real expense, because it dilutes shareholders, but it involves no cash, so the indirect method adds it back to operating cash flow. That makes FCF look better than net income for any company that pays staff heavily in stock. The size of the effect varies a lot. For Visa, SBC was $928 million, about 4% of FCF, so FCF minus SBC is still 89.9% of net income. For Microsoft, $12,405 million of SBC was 18.5% of FCF, and conversion after SBC drops from 50.1% to 40.8%. For Amazon, SBC exceeded FCF outright. Either subtract SBC from FCF, or keep it and value the company on a diluted share count that includes future grants; doing neither double-counts the benefit. The same logic applies in a DCF valuation, where FCF is the input and every adjustment flows into the fair value.
When is net income above FCF a red flag?
Net income above FCF is a red flag when it persists for several years and capex does not explain it. If the gap sits in operating cash flow, not in capex, profit is being recognised faster than cash is collected, and that is where earnings-quality problems usually live. Microsoft and Amazon do not fit that pattern: their operating cash flow exceeds net income, and the gap opens only after capex, which is disclosed and explained in the 10-K. The worrying pattern is operating cash flow below net income year after year, with receivables outgrowing revenue, inventory piling up, revaluation gains inflating profit, or stretched supplier payables propping up cash. Also check what a company excludes from its own FCF. Amazon's 10-K notes that its FCF "does not incorporate the portion of payments representing principal reductions of debt or cash payments for business acquisitions." Finance leases and acquisitions can move real cash outside the capex line.
How do you check FCF vs net income yourself?
You need the cash flow statement and three years of data; our guide to reading a 10-K shows where it sits.
- Copy net income, operating cash flow and capex for the last three fiscal years from the cash flow statement.
- Compute OCF ÷ net income. Below 100% for two or more years is the first warning sign.
- Compute FCF = OCF − capex, and FCF ÷ net income. Note the trend, not just the latest year.
- If conversion is low, check capex as a share of revenue. A rising share with explained investment (data centres, fulfilment, fabs) is a different story from flat capex and falling cash.
- Scan the working capital lines. Compare receivable and inventory growth with revenue growth.
- Look for non-cash gains in net income (investment gains, revaluations) and non-recurring cash items (litigation, tax payments).
- Recompute conversion after subtracting stock-based compensation.
- Read the company's own FCF definition, if it reports one, and note what it leaves out.
If you would rather not copy numbers by hand, you can ask the PickSkill AI analyst to pull recent cash flow statements for a ticker, compute FCF conversion with and without SBC, and walk through the bridge line by line. You can also look at that alongside the stock's technical picture on pages such as Microsoft, Visa and Amazon. Always check the result against the filing itself.
This article is for research and education only, not investment advice. All figures are from the companies' annual reports on SEC EDGAR, as filed on the dates shown.
FAQ
Why is free cash flow different from net income? Net income uses accrual accounting: it counts revenue when earned, spreads asset costs through depreciation and includes non-cash items. Free cash flow counts cash: it adds back depreciation and other non-cash charges, adjusts for changes in receivables, inventory and payables, and subtracts capital expenditures in full. The bigger a company's capex or working capital swings, the bigger the gap.
What is a good FCF conversion ratio? FCF conversion is FCF divided by net income. Near or above 100% means profits are backed by cash. Asset-light businesses often sit close to that level; Visa's was 93.8% in fiscal 2026. Capex-heavy companies can be far lower during investment phases, like Microsoft at 50.1%. Judge the trend and the reason, not one year.
Can free cash flow be higher than net income? Yes. It happens when depreciation and other non-cash charges exceed capex, when working capital releases cash, or when net income includes large non-cash losses. Visa's FCF was 107.6% of net income in fiscal 2025, and Amazon's was 121.0% in 2023. Sustained conversion far above 100% is worth a check that the company is not underinvesting.
Is free cash flow a GAAP measure? No. US GAAP defines net income and operating cash flow, but free cash flow is a non-GAAP measure, and companies define it differently. A common definition is operating cash flow minus capex; Amazon subtracts capex net of proceeds from sales and incentives. When comparing companies, rebuild FCF yourself from the cash flow statement using one consistent definition.
Should I subtract stock-based compensation from free cash flow? It is a sensible, conservative adjustment, because SBC is a real cost to shareholders even though no cash leaves the company. For Microsoft it cut fiscal 2026 conversion from 50.1% to 40.8%; for Amazon it turned 2025 FCF negative. If you keep SBC in FCF, value the company on a fully diluted share count instead.