Golden Cross vs MACD Crossover: Speed, Lag, Overlap
Golden cross vs MACD golden cross: how each is calculated, which fires first, and how often each hit the S&P 500 and CSI 300 in Nov 2026, with real counts.
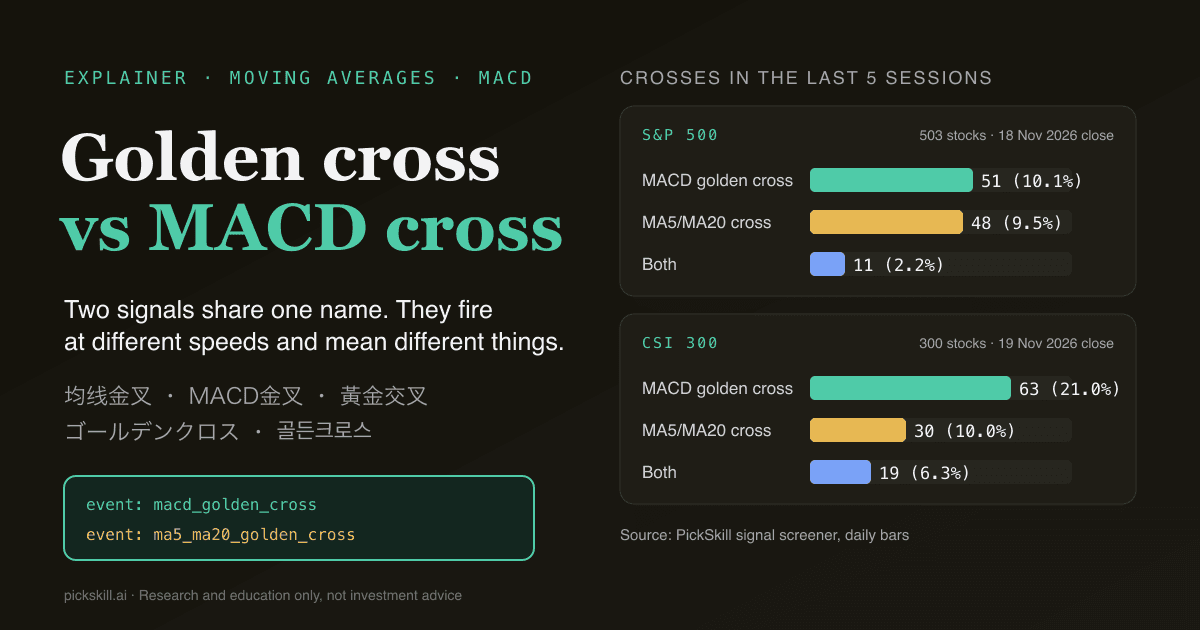
A moving-average golden cross and a MACD golden cross are two different signals that share one name. A golden cross is a faster moving average crossing above a slower one on the price chart (50/200-day in US usage, 5/20-day in most Asian apps), while a MACD golden cross is the DIF line crossing above its 9-day signal line (DEA). In the last 5 sessions to 18 Nov 2026, 51 S&P 500 stocks had a MACD golden cross and 48 had an MA5/MA20 cross, but only 11 had both (PickSkill signal screener).
The confusion is mostly a language problem. English readers who say "golden cross" usually mean the slow 50/200-day cross. Chinese readers say 金叉 for both 均线金叉 and MACD金叉, and Japanese and Korean chart apps usually apply ゴールデンクロス and 골든크로스 to short MA pairs. This post separates the signals, explains why MACD tends to move first, and uses fresh screener counts to show how rarely they agree.
Key takeaways
- Golden cross = a short moving average crossing above a long one on price. MACD golden cross = DIF (EMA12 − EMA26) crossing above DEA (a 9-day EMA of DIF).
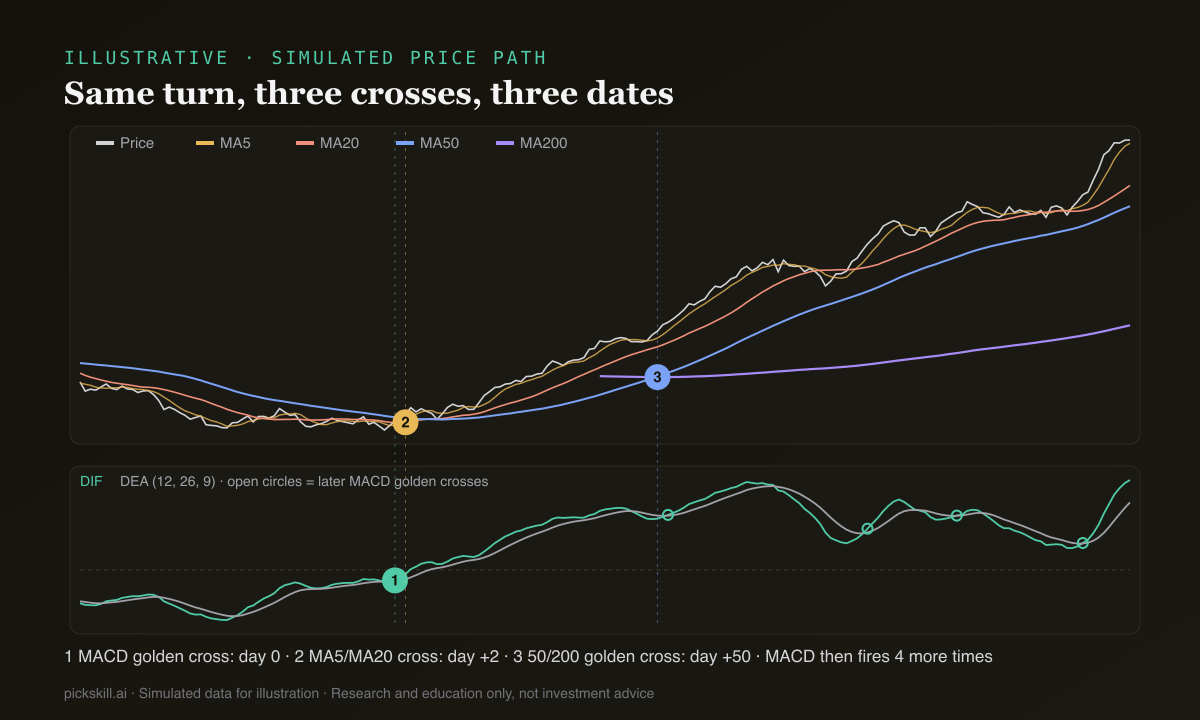
- MACD reacts to a change in momentum, so in a turn it usually fires before the MA crosses. It runs well ahead of the 50/200-day cross and roughly level with a short 5/20-day cross.
- In the last 5 sessions, MACD golden crosses hit 10.1% of the S&P 500 (18 Nov 2026) and 21.0% of the CSI 300 (19 Nov 2026). MA5/MA20 crosses hit 9.5% and 10.0%.
- Overlap is small: 11 of 503 S&P 500 stocks and 19 of 300 CSI 300 stocks had both crosses in the same window.
- Faster signals are noisier. Use the slow cross for the trend, MACD for timing, and the short MA cross as confirmation.
What is the difference between a golden cross and a MACD golden cross?
A golden cross happens on the price chart: a shorter simple moving average (SMA) closes above a longer one. The classic US version uses the 50-day and 200-day SMAs, and its meaning is regime change, from a long downtrend to a long uptrend. A MACD golden cross happens in a separate indicator pane. MACD's DIF line is the 12-day exponential moving average (EMA) minus the 26-day EMA, and DEA, the signal line, is a 9-day EMA of DIF. When DIF crosses above DEA, the gap between the two EMAs has started to widen upward (or shrink downward more slowly). That measures acceleration, not trend. Put simply, the MA golden cross says "the trend has turned" and the MACD golden cross says "momentum is turning". Fidelity's MACD guide gives the same 12/26/9 defaults and notes that MACD whipsaws in trading ranges.
For a full walk-through of each signal on its own, see what is a golden cross and death cross and what is MACD.
Why does "golden cross" mean different things in different markets?
It depends on the default chart, not the maths. US financial media built the term around the 50/200-day SMA pair, so an English-language "golden cross" headline almost always means that slow signal. Chinese trading apps show MA5, MA10, MA20 and MA60 by default and plot MACD under the price, so 金叉 can mean 均线金叉 (for example, the 5-day crossing the 10-day or 20-day) or MACD金叉 (DIF crossing DEA). KDJ crosses are called 金叉 too. Japanese charts commonly pair the 5-day and 25-day (or 25-day and 75-day) averages, and Korean apps usually use 5/20-day lines. That is why an article from one market can confuse readers from another. Whenever someone says "golden cross", ask which lines and which periods before comparing results.
| Signal | Typical periods | Lag in a turn | False-signal rate | Best use |
|---|---|---|---|---|
| Long MA golden cross | 50/200-day SMA (US) | Very high: weeks to months after the low | Low, but late | Defining the long-term regime |
| Short MA golden cross | 5/10, 5/20 (CN, KR), 5/25 (JP) SMA | Low: a few days | High in sideways markets | Confirming a short-term turn |
| MACD golden cross | DIF vs DEA, (12, 26, 9) EMA | Lowest: often at or before the short MA cross | High; whipsaws in ranges | Early timing within a known trend |
| MACD zero-line cross | DIF above 0 (EMA12 above EMA26) | Medium: after the MACD golden cross | Medium | Checking that momentum has turned positive |
The lag column follows from the averages themselves: an N-day simple average is on average (N − 1)/2 days old, so the 200-day line lags about 100 days and the 20-day line about 10. "False-signal rate" is a qualitative ranking, not a measured statistic.
Which crosses first, MACD or the moving average?
In a typical turn the MACD golden cross comes first, because of how it is built. It uses EMAs, which weight recent closes more heavily than SMAs do. And it compares DIF with DIF's own average, so it fires when the decline starts to slow, before the EMAs themselves have crossed. The DIF zero-line cross is itself a moving-average cross (EMA12 over EMA26), and the MACD golden cross normally comes before it. Against the 50/200-day golden cross the lead can be weeks or months. Against a short 5/20-day cross it is small, because a 5-day SMA is also very fast.
The real data agrees with the second point. Among the 11 S&P 500 stocks with both crosses in the 5-session window, 9 crossed on the same day and 2 had the MACD cross first. Among the 19 CSI 300 stocks, 7 crossed together, 6 had MACD first and 6 had the MA5/MA20 cross first. So "MACD is always first" is too strong. It is reliably ahead of slow MA crosses, but often level with fast ones.
How often does each golden cross fire?
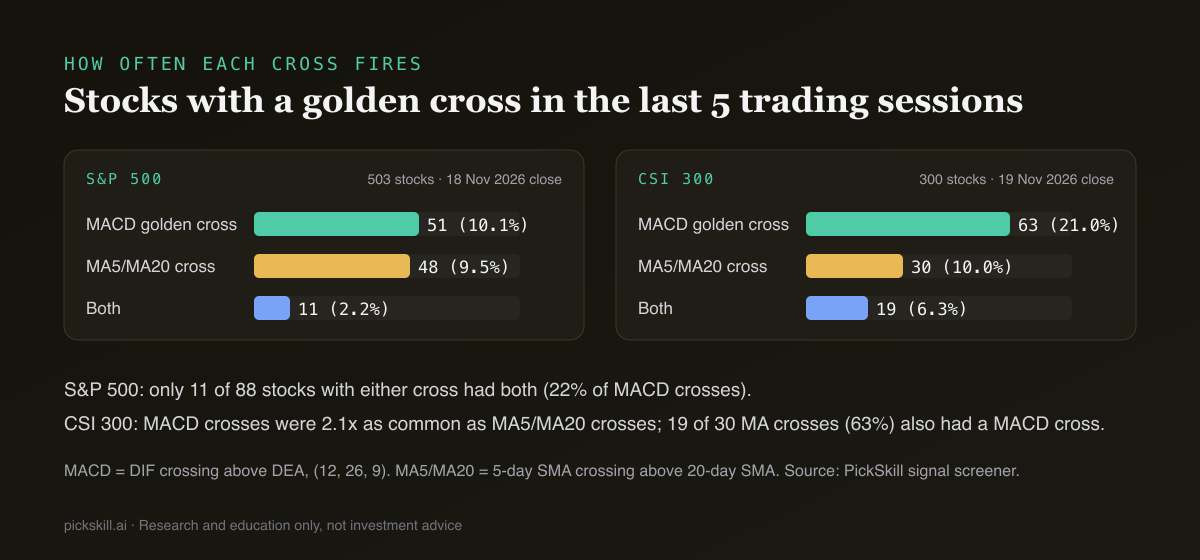
We ran three screens on each index with the PickSkill signal screener: MACD golden cross within 5 trading days, MA5/MA20 golden cross within 5 trading days, and both conditions together. US data is as of the 18 Nov 2026 close and CSI 300 data as of the 19 Nov 2026 close. On the S&P 500 the two signals fired at similar rates (51 vs 48 stocks), but only 11 stocks had both, so most of the time they flag different names. On the CSI 300 MACD crosses were twice as common (63 vs 30). Many of those CSI 300 crosses landed on the same few sessions, which points to an index-wide turn in momentum rather than stock-specific news, and many members had MACD turning up before their 5-day line had cleared the 20-day.
| Index (as of) | Screened | MACD golden cross | MA5/MA20 cross | Both |
|---|---|---|---|---|
| S&P 500 (18 Nov 2026) | 503 | 51 (10.1%) | 48 (9.5%) | 11 (2.2%) |
| CSI 300 (19 Nov 2026) | 300 | 63 (21.0%) | 30 (10.0%) | 19 (6.3%) |
Source: PickSkill signal screener, daily bars, events within the last 5 trading sessions.
Two readings follow. First, a single cross is common: in a week, roughly one stock in ten (and one in five in the CSI 300 that week) flashes a MACD golden cross, so the event alone cannot be a strong edge. Second, requiring both crosses removes most of the list (88 S&P 500 names had at least one, 11 had both). That is how stacking conditions works.
Which is more reliable, a MACD golden cross or an MA golden cross?
Neither is more reliable on its own. They answer different questions and trade speed for noise. The MACD golden cross is the earliest signal, so it catches more of the move. It also fires more often and reverses more often, especially when price is moving sideways and DIF keeps crossing DEA. A short MA golden cross arrives at about the same time and is just as easy to fake in a range. The 50/200-day golden cross produces far fewer false starts, but by the time it prints, much of the rebound has already happened. In practice, reliability comes from combining them: the slow trend filter removes most counter-trend MACD crosses, and the MA cross confirms that price has followed momentum. Our MACD confirmation guide lists five filters that cut false signals further.
How do you use the MA golden cross and MACD golden cross together?
A simple layered routine keeps each signal in the job it is good at:
- Set the regime with the slow lines. Note whether the stock is above a rising 200-day line, or past a 50/200-day golden cross. If it is not, treat every faster cross as a counter-trend bounce.
- Use the MACD golden cross as the alert. It is the earliest of the three. A cross near or above the zero line carries more weight than one deep below it.
- Wait for the short MA cross to confirm. An MA5/MA20 (or 5/10, 5/25) cross within a few sessions shows that price has followed momentum.
- Check the histogram and volume. MACD bars should grow for the next one or two sessions, and volume should not be shrinking.
- Define the exit before entering. A MACD death cross or a close back below the 20-day line cancels the setup.
- Screen for both at once. In the PickSkill screener, add
macd_golden_crossandma5_ma20_golden_crossas two event conditions; they are ANDed automatically.
On the CSI 300, step 6 alone took 63 MACD crosses down to 19. For a worked A-share example with more filters, see the CSI 300 MACD golden cross screen. For the general screener steps, see how to screen stocks for a golden cross.
Can you screen for both crosses on PickSkill?
Yes. The PickSkill signal screener covers about 950 stocks across the S&P 500, Nasdaq-100, Hang Seng and CSI 300, and it refreshes after each market close. Both events take a within_days window of 1 to 5 sessions. Through the MCP server or REST API, the "both" screen used in this post looks like this:
{
  "indices": ["csi300"],
  "conditions": [
    { "type": "event", "event": "macd_golden_cross", "within_days": 5 },
    { "type": "event", "event": "ma5_ma20_golden_cross", "within_days": 5 }
  ]
}
PickSkill's MA5 and MA20 are simple averages of daily closes, and its MACD uses the standard (12, 26, 9) settings. Index context is on the S&P 500 and CSI 300 hubs. The screener is part of the Pro and Power plans, and Free users see the match count.
All numbers in this post are for research and education only, not investment advice.
FAQ
Is a MACD crossover the same as a golden cross? No. A golden cross is a short moving average crossing above a long one on the price chart, classically the 50-day over the 200-day. A MACD golden cross (crossover) is the DIF line crossing above its 9-day signal line. Both are bullish crossovers, but MACD measures momentum and usually fires earlier and more often.
Which is more accurate, a MACD golden cross or a moving-average golden cross? Neither is accurate alone. MACD is earlier but whipsaws in sideways markets. A 50/200-day cross is steadier but late. A short 5/20-day cross is about as fast and as noisy as MACD. Combining them works better: on the S&P 500 on 18 Nov 2026, only 11 of 88 stocks with either cross had both.
Does the MACD golden cross always happen before the MA golden cross? Usually before the 50/200-day cross, often by weeks. Against a fast 5/20-day cross it is close. Of the CSI 300 stocks with both crosses in the 5 sessions to 19 Nov 2026, 7 crossed the same day, 6 had MACD first and 6 had the MA cross first.
What moving averages does a golden cross use? It depends on the market. US usage means the 50-day crossing the 200-day. Chinese apps commonly call a 5/10 or 5/20-day cross a 均线金叉, Japanese charts often use 5/25 or 25/75-day pairs, and Korean apps usually use 5/20-day lines. Always check the periods before comparing signals.
How many stocks have a MACD golden cross in a typical week? It varies with the market. In the 5 sessions to 18 Nov 2026, 51 of 503 S&P 500 stocks (10.1%) had one. In the 5 sessions to 19 Nov 2026, 63 of 300 CSI 300 stocks (21.0%) did, with many crosses clustered on the same sessions. A single cross is a common event, which is why confirmation matters.