KDJ Passivation: Why KDJ Stops Working in Trends
KDJ passivation is when K, D and J stay pinned above 80 or below 20 in a strong trend. Why the RSV formula causes it, what to check, real CSI 300 examples.
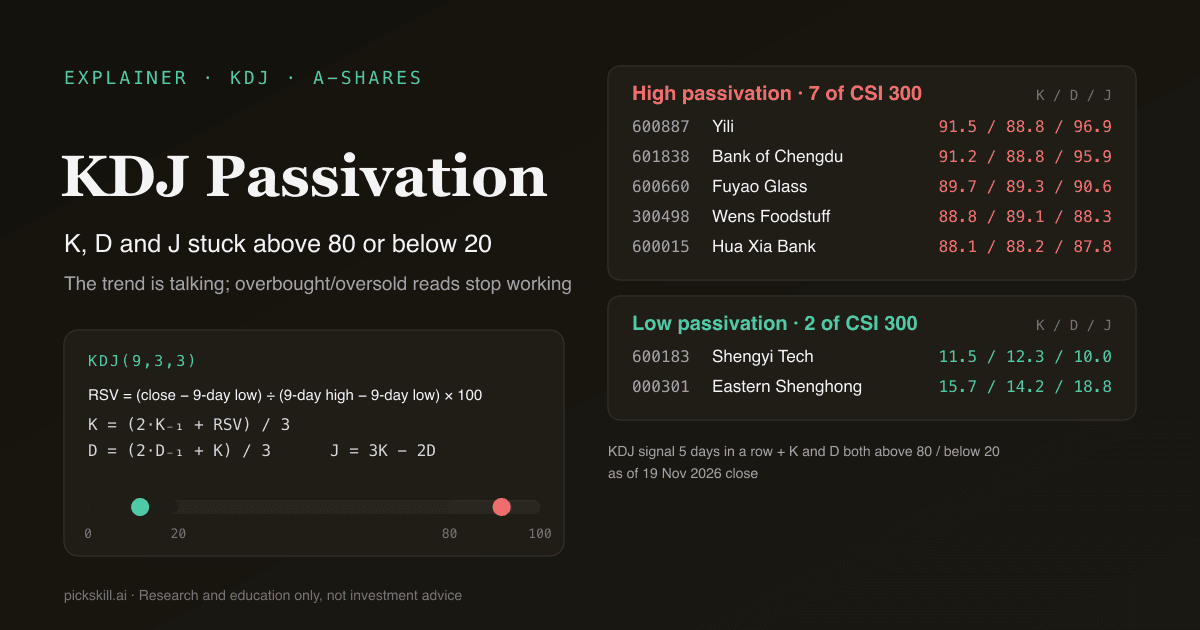
KDJ passivation (钝化, "blunting") is when the K, D and J lines stay pinned above 80 or below 20 for many bars during a strong trend, so overbought, oversold and crossover signals keep failing. It is not a broken indicator: it follows directly from KDJ's 9-day high-low formula, because a stock that closes near its 9-day high every day keeps K near 100. As of the 19 Nov 2026 close, CSI 300 member Yili (600887) had K above 80 on 26 of its last 40 trading days while the stock rose from CNY 26.56 to 32.91.
The term comes from Chinese A-share trading, where KDJ is the default oscillator in almost every charting app. Passivation is information in itself: it tells you the market is trending, not ranging. If you are new to the indicator, start with What Is KDJ?.
Key takeaways
- Definition: K and D (often with J) stay above 80 (high passivation) or below 20 (low passivation) for several sessions; crosses inside the zone mostly fail.
- Cause: RSV = (close − 9-day low) ÷ (9-day high − 9-day low) × 100. Closes near the top of the range keep RSV near 100, and K and D follow it.
- Live count: at the 19 Nov 2026 close, 50 CSI 300 stocks had K above 80 and 66 had K below 20, but only 7 and 2 met a stricter passivation screen (5-day KDJ signal streak plus K and D both in the zone).
- Low passivation is the costlier trap: Shengyi Technology (600183) printed four golden crosses below 20 between September and November while it fell from CNY 146.03 to 60.29, about −58.7%.
- What to do: switch to trend tools (moving averages, ADX, MACD), check the weekly KDJ, wait for J to leave the extreme plus a K/D cross, and watch for divergence.
- A-share twist: limit-up and limit-down streaks pin RSV at 100 or 0, so passivation arrives faster than in US stocks.
What does KDJ passivation mean?
KDJ passivation means the oscillator has stopped oscillating. In a range-bound market, K pushes above 80, turns down within a few days, and a death cross near the top marks a pullback. In a strong trend, K pushes above 80 and stays there; when a death cross does appear, price pauses for a day or two and then keeps climbing. Low passivation is the mirror image: K and D keep crossing up below 20 while price keeps making new lows.
There is no single official threshold. A common rule of thumb is K above 80 (or below 20) for three or more sessions in a row. In this post we use a stricter screen: PickSkill's KDJ signal held the same direction for 5 consecutive sessions and both K and D are in the zone today. J, defined as 3K − 2D, swings the widest and often goes above 100 or below 0 during passivation, so it works as a magnifier of how deep the passivation is.
Why does KDJ get stuck above 80 or below 20?
Passivation is baked into the formula. PickSkill, like most A-share charting software, uses KDJ(9,3,3):
RSV = (close − lowest low of 9 days) ÷ (highest high of 9 days − lowest low of 9 days) × 100
K   = (2 × previous K + RSV) ÷ 3
D   = (2 × previous D + K) ÷ 3
J   = 3K − 2D
RSV only measures where today's close sits inside the last 9 days' range. A stock closing near a fresh 9-day high every day keeps RSV close to 100, and K closes a third of the gap to RSV each day. Starting from K = 50 with RSV at 100, K goes 66.7, 77.8, 85.2: inside the zone by day three.
Getting out is harder than getting in. For K to fall from 90 to below 80 in one session you need (2 × 90 + RSV) ÷ 3 < 80, which means RSV under 60: the close has to land in the bottom 60% of the 9-day range. A shallow one-day dip in a strong trend rarely does that. This is the same behaviour George Lane's stochastic oscillator shows; StockCharts' ChartSchool article on the stochastic states plainly that securities can become overbought and remain overbought during a strong uptrend. See What Is the Stochastic Oscillator? for how KDJ relates to it.
What is the difference between high and low passivation?
High passivation happens in uptrends and signals persistent buying; low passivation happens in downtrends and signals that selling has not exhausted. The shapes are symmetric but the risks are not. Selling early in high passivation costs you the rest of the move. Buying a "golden cross below 20" in low passivation exposes capital to further decline.
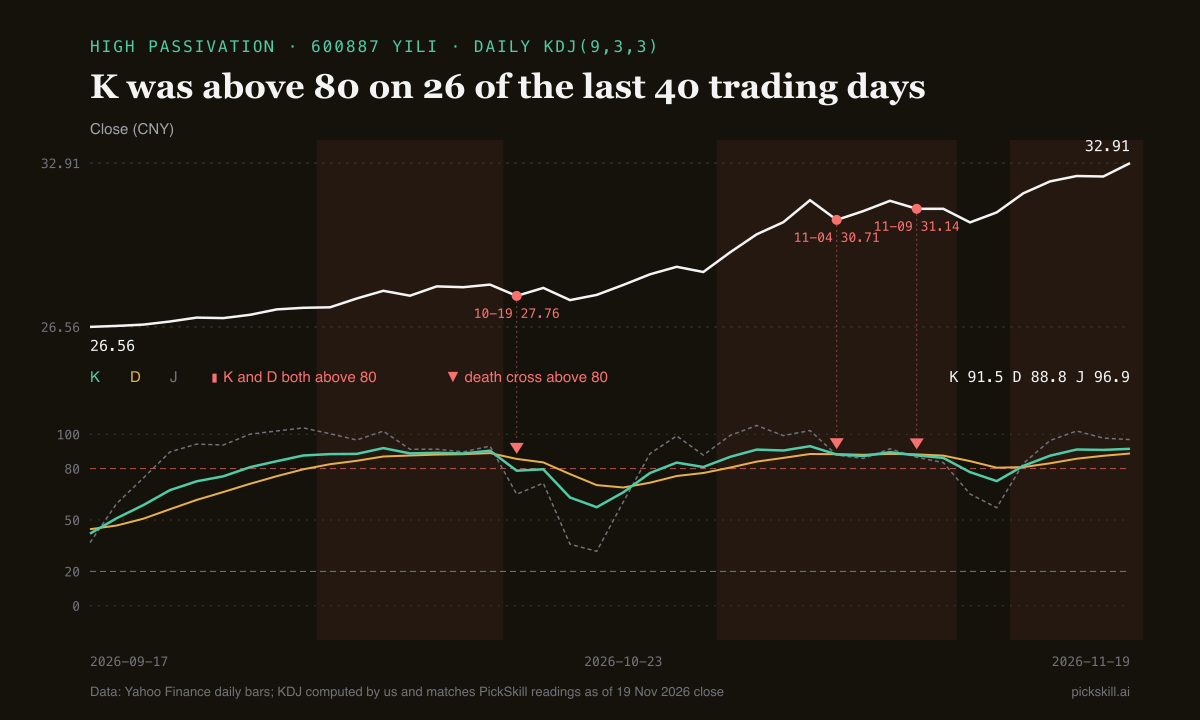
High passivation: Yili (600887). At the 19 Nov 2026 close Yili read K 91.5, D 88.8, J 96.9, with ADX at 60.58 and RSI(14) at 76.55. K was above 80 on 26 of the last 40 sessions and J above 100 on 8. Three death crosses with D above 80 (19 Oct at CNY 27.76, 4 Nov at 30.71, 9 Nov at 31.14) were each followed by higher prices; the 32.91 close on 19 Nov is about 7.2% above the 4 Nov cross.
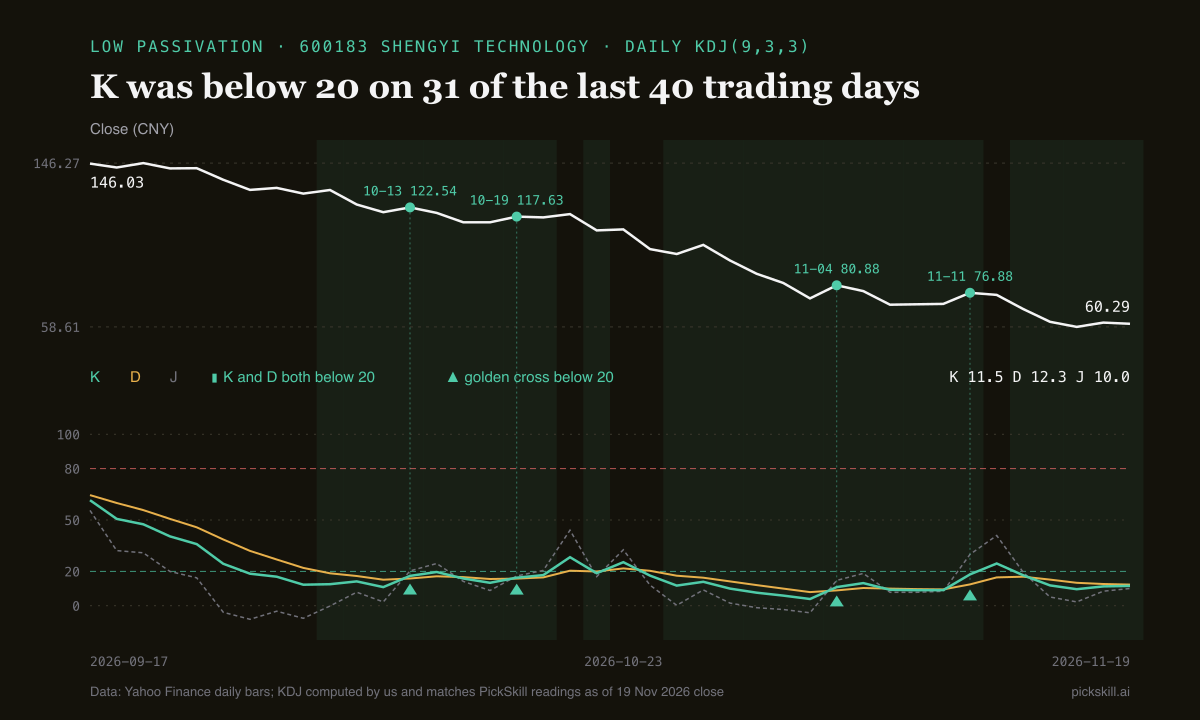
Low passivation: Shengyi Technology (600183). On the same date Shengyi read K 11.5, D 12.3, J 10.0, ADX 55.21, and a 5-day change of −20.37%. K was below 20 on 31 of the last 40 sessions and J below 0 on 8. Four golden crosses with K under 20 came on 13 Oct (CNY 122.54), 19 Oct (117.63), 4 Nov (80.88) and 11 Nov (76.88). The 60.29 close on 19 Nov is about 25.5% below the 4 Nov cross and 50.8% below the 13 Oct one.
| Passivation type | What it means | What to check |
|---|---|---|
| High (K, D > 80 for many bars) | Strong uptrend; closes keep hugging the 9-day high | MA stack bullish? ADX > 25? MACD above zero? Any bearish divergence? |
| Low (K, D < 20 for many bars) | Strong downtrend; selling not exhausted | Price still below MA20/MA60? ADX rising? Bullish divergence and volume stabilising? |
| J > 100 or J < 0 | Deepest stage of passivation | When does J return to 0–100, and does a K/D cross come with it? |
| Weekly KDJ also in the zone | Medium-term trend agrees; daily passivation likely to persist | Have weekly K and D started to turn? |
| Limit-up / limit-down streak | RSV forced to 100 or 0; little signal content | Has the limit opened, and on what volume? |
What should you do when KDJ passivates?
Treat passivation as a regime label: the market is trending, so hand the directional call to trend tools and use KDJ only to see when the trend is losing speed. In practice that means four checks. Confirm direction and strength with moving averages, ADX and MACD. Look at the weekly KDJ for the medium-term position. Wait for J to leave the extreme and for a K/D cross as the "passivation is over" signal. And watch for divergence between price and the oscillator.
Switch to trend tools. ADX measures trend strength regardless of direction; readings of 25 or more usually mean a trend is in place (see What Is ADX?). Yili's 60.58 and Shengyi's 55.21 are both very strong trends, exactly where passivation is normal. For MACD, see What Is MACD?.
Check the weekly KDJ. As of 19 Nov 2026 (week not yet closed), Yili's weekly K and D were about 96.4 and 93.6, and Shengyi's about 5.9 and 12.7, so both weekly readings agree with the daily trend. A weekly turn usually carries more weight than a daily death cross.
Wait for J to leave the extreme, then the cross. While J flips above 100 or below 0, a single K/D cross is often erased by the next day's new high or low. A sturdier confirmation is J back inside 0–100, a K/D cross, and price breaking a short moving average together.
Watch for divergence. Price making a higher high while J makes a lower high is bearish divergence; the reverse is bullish divergence. It flags fading momentum, not an immediate reversal. More in What Is Divergence?.
Why do A-share price limits make passivation worse?
Main-board A-shares have a ±10% daily limit, ChiNext and STAR stocks ±20%; main-board ST stocks moved from ±5% to ±10% on 6 July 2026. In a limit-up streak each close is also the day's high, and usually the 9-day high, so RSV sits at 100; a limit-down streak pushes it to 0. KDJ therefore passivates faster and harder than in US stocks, and "overbought" during a streak only says the stock is locked at the limit.
A one-price limit bar, where high equals low, carries no range information at all. PickSkill forces the signal on any bar with high equal to low (one-price limit days or halts) to neutral, and if the whole 9-day window is flat it carries the previous K and D forward instead of dividing by zero. Ordinary limit-up days with an intraday range are not masked, so check those yourself. More A-share context in Top 5 Technical Indicators for Chinese A-Shares.
How do you find stocks that are passivating right now?
The PickSkill signal screener can find them directly. PickSkill's KDJ dimension reads bearish when K and D are both above 80, bullish when both are below 20, bullish on a golden cross with K under 50, and bearish on a death cross with K over 50. So high passivation shows up as KDJ bearish for days while price rises, which is your cue to look at MA and ADX in the same snapshot.
Our screen: CSI 300 members; KDJ signal bearish (or bullish) for 5 sessions; K and D both above 80 (or both below 20) today. Results as of the 19 Nov 2026 close, from PickSkill's production signal table, shown only to illustrate the method:
- High passivation, 7 stocks: Yili 600887 (K 91.5 / D 88.8 / J 96.9), Bank of Chengdu 601838 (91.2 / 88.8 / 95.9), Fuyao Glass 600660 (89.7 / 89.3 / 90.6), Wens Foodstuff 300498 (88.8 / 89.1 / 88.3), Hua Xia Bank 600015 (88.1 / 88.2 / 87.8), Bank of Beijing 601169 (86.6 / 89.2 / 81.4), Spring Airlines 601021 (83.8 / 83.6 / 84.1). By our own daily-bar calculation, Spring Airlines' K has been above 80 for 13 straight sessions, the longest in the group.
- Low passivation, 2 stocks: Shengyi Technology 600183 (11.5 / 12.3 / 10.0) and Eastern Shenghong 000301 (15.7 / 14.2 / 18.8); Eastern Shenghong's K and D have both been below 20 for 9 sessions.
You can run the same query from an AI assistant through the PickSkill MCP server, or open the full 8-dimension readout on a stock page such as Yili, Shengyi Technology or the CSI 300 hub.
KDJ passivation checklist
- Confirm it: K and D above 80 or below 20 for 3–5+ sessions, with J repeatedly beyond 100 or 0.
- Check trend strength: ADX above 25 and rising; MA20 and MA60 stacked in the trend's direction.
- Check MACD: DIF and DEA on the same side of zero; is the histogram shrinking?
- Check the weekly KDJ: still in the zone, or turning?
- Do not act on one death cross above 80 or one golden cross below 20; wait for at least two of: J back inside 0–100, a K/D cross, price through the 5- or 20-day average.
- Look for divergence between price extremes and J.
- For A-shares, discount readings around limit streaks, one-price limit bars and resumptions after halts.
KDJ and RSI behave differently here; RSI's 70/30 bands are wider and it reacts more slowly. See KDJ vs RSI.
This article is for research and education only, not investment advice. Stock data is as of the 19 Nov 2026 close and is used only to illustrate the method.
FAQ
Does high KDJ passivation mean the stock will keep rising? No. High passivation only says recent closes have hugged the 9-day high, which describes a strong uptrend so far; it does not forecast the next move. Signs the trend is ending include J dropping back below 100 and continuing lower, a K/D death cross, price breaking a short moving average and ADX falling from a high level, ideally several at once.
Is it safe to buy when KDJ is passivated below 20? Low passivation means the downtrend is still in force, so buying on a golden cross below 20 alone is risky. Shengyi Technology printed four such crosses between September and November 2026 while falling from CNY 146.03 to 60.29. A more cautious approach waits for bullish divergence, stabilising volume and a reclaimed short moving average together.
What indicators should I use when KDJ passivates? Use trend indicators. Moving-average alignment gives direction, ADX gives trend strength (25 or more usually means a trend is in place), and MACD's position relative to zero and its histogram show momentum. Keep KDJ for timing on the weekly chart, or wait for J to leave the extreme before trusting a daily K/D cross.
How long can KDJ passivation last? There is no fixed length; it lasts as long as the trend stays strong. As of 19 Nov 2026, Yili had K above 80 on 26 of its last 40 sessions, Spring Airlines had K above 80 for 13 sessions in a row, and Shengyi Technology had K below 20 on 31 of 40 sessions. Several weeks is common in strong trends.
Is KDJ passivation the same as the stochastic staying overbought? Yes, it is the same effect. KDJ is a stochastic oscillator with a 9-day lookback, 3-period smoothing and an extra J line (3K − 2D). Classic stochastic users describe it as an indicator that "stays overbought" in strong uptrends; Chinese traders call it 钝化 and Taiwanese traders call the K/D-only version KD 鈍化.