How to Read RSI: 5 Patterns on Real Charts
How to read RSI on a real chart: 30/70, the 50 line, divergence, failure swings and 14 vs 9 settings, using SK hynix. RSI(14) sat above 70 on 104 of 457 days.
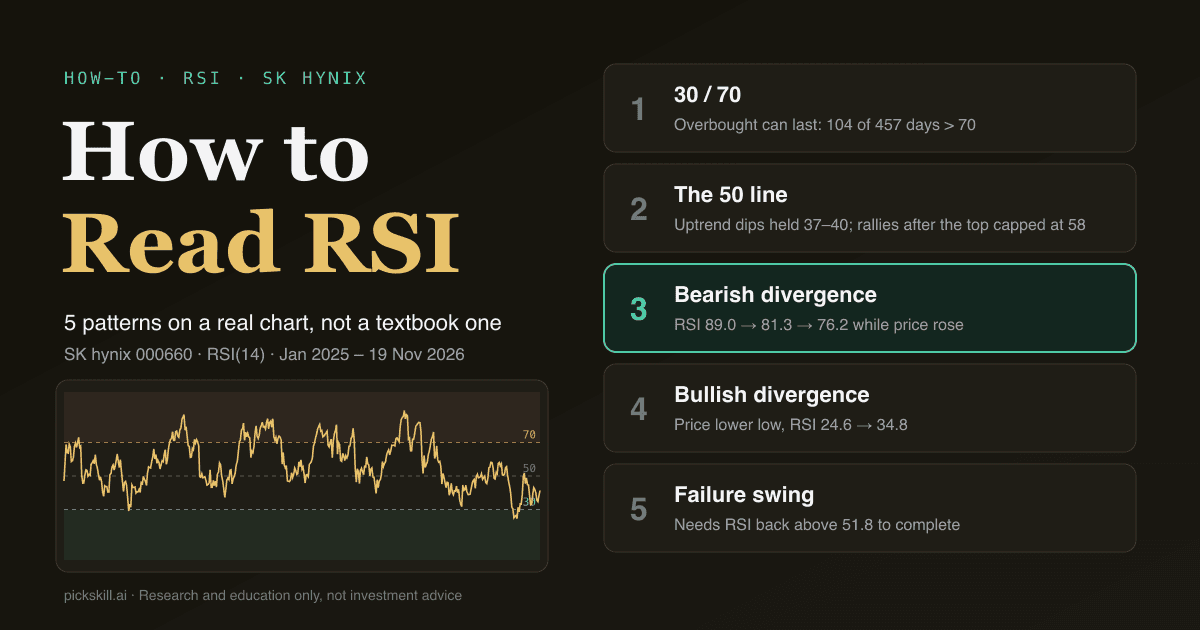
To read RSI well, treat 70 and 30 as measures of trend strength rather than buy or sell signals, then watch which range RSI holds around its 50 line, whether it diverges from price, and whether it completes a failure swing. RSI (Relative Strength Index) is a momentum oscillator that compares the size of recent gains and losses on a 0–100 scale, usually over 14 days. In strong trends it stays extreme for a long time: SK hynix's RSI(14) was above 70 on 104 of 457 trading days between 2 Jan 2025 and 19 Nov 2026 (Yahoo Finance data, PickSkill calculation).
Over that stretch SK hynix rose from ₩171,200 (2 Jan 2025) to ₩2,919,000 (22 Jun 2026), then fell back to ₩1,183,000 by the 19 Nov 2026 close, during the KOSPI rally and its reversal. One chart holds an uptrend, a top and a downtrend, which makes it a good place to show all five ways of reading RSI. For the formula and history, start with What Is RSI? and KDJ vs RSI.
Key takeaways
- Above 70 is not a sell signal. SK hynix's RSI(14) stayed above 70 for 21 straight sessions (2 Oct – 6 Nov 2025) while the stock rose from ₩395,500 to ₩593,000.
- The range around 50 tells you the trend. In the uptrend, pullbacks bottomed with RSI near 37–40; after the top, the best rally stalled at 58.2.
- Bearish divergence flagged the top. Price kept making highs while RSI peaks fell 89.0 → 81.3 → 76.2; the stock then dropped 55% from 22 Jun to 30 Jul 2026.
- A bullish divergence is forming now. The 17 Nov low (₩1,098,000) undercut 20 Oct (₩1,223,000), but RSI rose from 24.6 to 34.8. It is unconfirmed.
- Stick with 14 unless you trade very short-term. RSI(9) produced 22 overbought runs and 16 oversold days in the same period, against 14 and 6 for RSI(14).
What do RSI 30 and 70 actually mean?
RSI above 70 is called overbought and below 30 oversold, thresholds J. Welles Wilder set when he introduced the indicator in 1978. Read literally, they mean recent gains have heavily outweighed recent losses (or the reverse). They do not mean a stock is expensive or about to turn. StockCharts ChartSchool notes that momentum oscillators can stay overbought or oversold for long periods in strong trends, and SK hynix shows it. Since January 2025 its RSI(14) crossed above 70 on 14 separate occasions; in 11 of them, the stock was higher 60 trading days after the first day above 70. Selling every time RSI hit 70 would have missed most of the 2025–2026 advance.
So a practical reading is: in an uptrend, a move above 70 confirms strength, and the more useful warning comes when RSI falls back below 70. In a downtrend, a drop below 30 confirms weakness, and a recovery is more credible when RSI climbs back above 30 alongside a divergence or failure swing. To scan for oversold stocks systematically, see How to Find Oversold Stocks.
What do the 5 RSI patterns look like on a real chart?
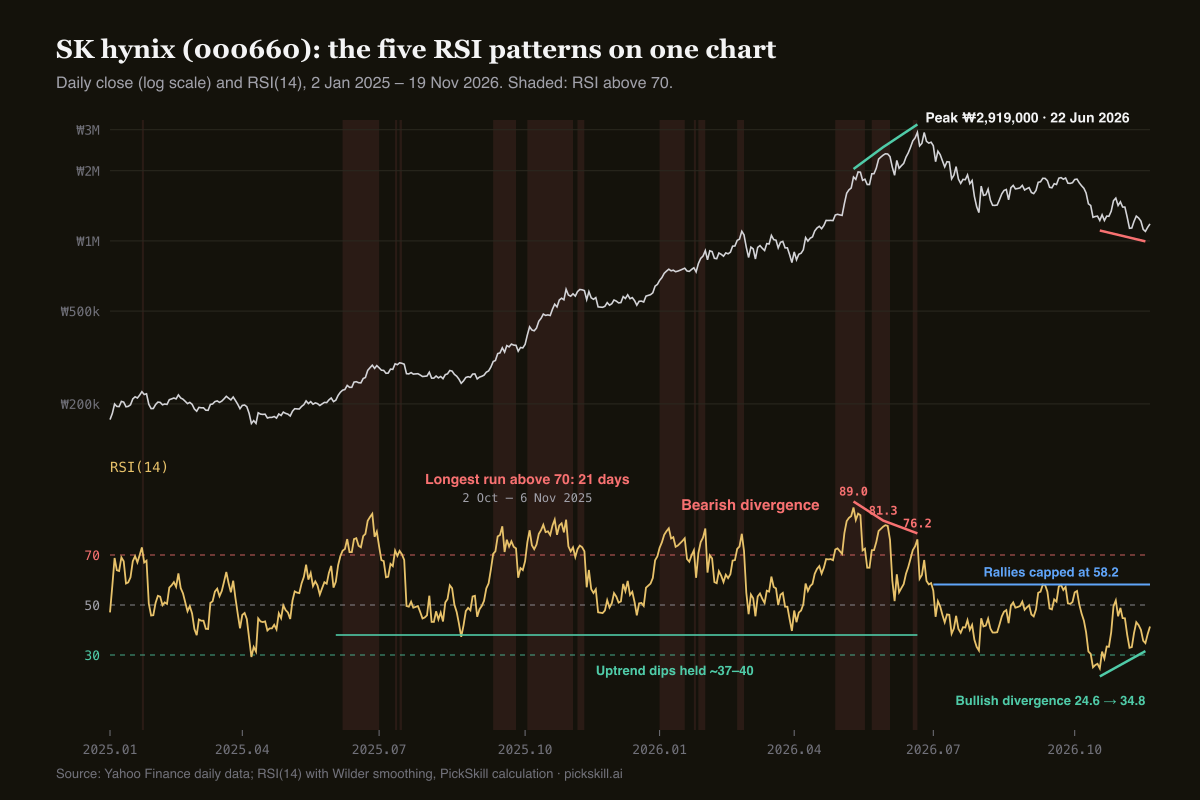
The chart below shows SK hynix's daily close (top, log scale) and RSI(14) (bottom) from January 2025 to November 2026, with days above 70 shaded. All five patterns appear: long overbought runs in the uptrend, pullbacks that held around 37–40, a bearish divergence into the top, rallies capped at 58.2 after it, and a bullish divergence in October and November. The table gives the rule and the dates for each.
| Pattern | How to read it | SK hynix example | Outcome |
|---|---|---|---|
| 1. 30/70 | With the trend, 70 or 30 confirms strength | Above 70 for 21 sessions, 2 Oct – 6 Nov 2025 | ₩395,500 → ₩593,000 |
| 2. The 50 line and range | Bull range 40–90, bear range 10–60 | Uptrend lows 37.3 (21 Aug 2025), 39.6 (31 Mar 2026); post-top high 58.2 (9 Sep 2026) | Range shift = trend shift |
| 3. Bearish divergence | Higher price high, lower RSI high | 89.0 (11 May) → 81.3 (29 May) → 76.2 (22 Jun) | −55% from 22 Jun to 30 Jul |
| 4. Bullish divergence | Lower price low, higher RSI low | 24.6 (20 Oct, ₩1,223,000) → 34.8 (17 Nov, ₩1,098,000) | Unconfirmed as of 19 Nov |
| 5. Failure swing | Below 30 → bounce → pullback holds above 30 → break of the bounce high | 24.6 → 51.8 → 32.9; waiting for a break of 51.8 | Incomplete as of 19 Nov |
How does the RSI 50 line work in a trend?
The 50 line is the balance point between gains and losses, and in a trending market the range RSI holds relative to 50 tells you more than 70 or 30 do. According to ChartSchool, Constance Brown observed that RSI tends to move between 40 and 90 in bull markets, with 40–50 acting as support, and between 10 and 60 in bear markets, with 50–60 acting as resistance. SK hynix matched that closely. From June 2025 to the June 2026 peak, its deepest pullbacks stopped with RSI(14) at 37.3 (21 Aug 2025) and 39.6 (31 Mar 2026). After the top, from July to November 2026, the strongest rally peaked at 58.2 on 9 Sep.
This range shift is useful in practice. When RSI dips toward 40 in an uptrend and then recovers above 50, the trend is intact. When rallies keep failing at 50–60, the downtrend is still in charge. On 19 Nov 2026, RSI(14) was 41.4 for SK hynix and 40.1 for Samsung Electronics, both still inside a bear-market range; the PickSkill pages for SK hynix and Samsung labelled RSI "Neutral · in range".
How do you spot RSI divergence, and when can you trust it?
RSI divergence is when price and RSI point in different directions. Higher price highs with lower RSI highs is a bearish divergence; lower price lows with higher RSI lows is a bullish divergence. To find one, connect two or three price highs (or lows) and compare the RSI readings on the same dates. A divergence warns that momentum is fading, but it does not time the reversal; ChartSchool cautions that a strong uptrend can show several bearish divergences before a top forms. The broader concept is covered in What Is Divergence?
SK hynix's 2026 top is a textbook case. RSI was 89.0 at ₩1,880,000 on 11 May, 81.3 at ₩2,333,000 on 29 May, and 76.2 at ₩2,919,000 on 22 Jun. Price rose another 55% while each RSI peak was lower. Note the timing: after the first divergence on 29 May, the stock still gained 25% over the next three and a half weeks, so selling on the divergence alone meant missing the last leg. The decline began the next day, 23 Jun, when RSI fell back below 70 (to 60.5), and accelerated after RSI broke 50 on 2 Jul (45.3). By 30 Jul the close was ₩1,322,000, 55% below the peak.
The opposite setup is forming now. On 20 Oct, SK hynix closed at ₩1,223,000 with RSI at 24.6; on 17 Nov it closed lower at ₩1,098,000 with RSI at 34.8. Samsung shows the same shape: ₩210,000 with RSI 27.7 on 15 Oct, then ₩188,700 with RSI 31.7 on 6 Nov. Both are bullish divergences in form, but neither is confirmed while RSI stays below 50. To scan a whole portfolio for this pattern, see How to Find Bullish Divergences Across a Portfolio.
What is an RSI failure swing, and how do you confirm one?
A failure swing is a pattern Wilder described alongside divergence; ChartSchool calls failure swings "strong indications of an impending reversal" that are judged on RSI alone, ignoring price. A bullish failure swing needs all four steps below; a bearish one is the mirror image around 70. The final step is the signal: until RSI clears the earlier bounce high, the pattern is only in progress.
- RSI drops below 30. SK hynix: 24.6 on 20 Oct 2026.
- RSI bounces back above 30. It reached 51.8 on 29 Oct. That high becomes the trigger level.
- RSI pulls back but holds above 30. It bottomed at 32.9 on 6 Nov without breaking 30 again.
- RSI breaks above the step-2 high (51.8). That completes the bullish failure swing. On 19 Nov 2026 RSI was 41.4, so this step has not happened.
A bullish divergence and a developing failure swing in the same window is worth noting, but both are unconfirmed. Whether this is a bounce in a downtrend or a turn depends on RSI clearing its 50–60 resistance band and on what the moving averages do. The moving-average side, using the same two stocks, is in Golden Cross Trading Strategy.
Should you use RSI 14 or RSI 9?
For most purposes, Wilder's default of 14 days is the better choice. A shorter period makes RSI more sensitive, so it crosses 70 and 30 more often; a longer one smooths it. Short-term traders use 9 for speed, but extremes become so common that 70 and 30 lose meaning. Running both settings on the same SK hynix data (2 Jan 2025 – 19 Nov 2026, 457 sessions) shows the difference.
| Measure | RSI(14) | RSI(9) |
|---|---|---|
| Days above 70 | 104 | 122 |
| Days below 30 | 6 | 16 |
| Separate runs above 70 | 14 | 22 |
| Longest run above 70 | 21 sessions (2 Oct – 6 Nov 2025) | 19 sessions (2 Oct – 4 Nov 2025) |
| Peak near the May 2026 high | 89.0 (11 May) | 94.7 (11 May) |
In January 2025 alone, RSI(9) produced three separate runs above 70, and the stock was lower 60 sessions after each one. RSI(14) crossed 70 once that month. Faster settings trade noise for speed. Keep 14 as the default and reserve 9 for pairing with short-term signals such as the 5/20-day moving average cross. A weekly RSI(14) gives a slower, steadier read on whether the bigger trend is overheated.
How can you check RSI in PickSkill?
PickSkill's stock pages update RSI(14) after each close as one of eight indicators, alongside MACD, moving averages, KDJ, Bollinger Bands, ADX/DMI, volume and money flow, each with a five-day signal trail. Reading RSI next to trend tools such as ADX and the moving averages makes it easy to see whether a range shift or divergence agrees with the trend. Indicator explanations are on the indicators page, and portfolio indicators shows all eight signals for every holding on one screen. Korean stocks were added in November 2026; for the index-level view, see KOSPI Technical Analysis, and for splitting work between the two most popular oscillators, MACD vs RSI.
This article is for research and education only, not investment advice. Patterns on past charts do not guarantee future results.
FAQ
What do RSI 30 and 70 mean? RSI above 70 is called overbought and below 30 oversold, levels J. Welles Wilder proposed in 1978. They mean recent gains have heavily outweighed losses, or the reverse, not that a reversal is due. SK hynix's RSI(14) was above 70 on 104 of 457 trading days from January 2025 to November 2026, and 11 of its 14 runs above 70 were followed by a higher price 60 sessions later.
How do you read RSI in a strong uptrend? Expect RSI to stay above 70 for long stretches; SK hynix held above 70 for 21 straight sessions in October and November 2025 while rising 50%. Instead of selling at 70, watch for RSI falling back below 70, for bearish divergence between price and RSI highs, and for a break below the 40–50 support band that held during the uptrend.
How reliable is RSI divergence? Divergence is an early warning, not a timing signal. After SK hynix's first bearish divergence on 29 May 2026, the stock still rose 25% before peaking on 22 Jun. The decline started when RSI fell below 70 and sped up when it broke 50. Use a confirmation such as a 50-line cross or a completed failure swing.
Is RSI 14 or RSI 9 better? RSI 14 suits most traders. On SK hynix data from 2025 to 2026, RSI(9) produced 22 separate runs above 70 versus 14 for RSI(14), and 16 days below 30 versus 6. The shorter setting reacts faster but gives many more false extremes, so it fits only very short-term trading paired with other signals.
What is an RSI failure swing? A bullish failure swing is when RSI falls below 30, bounces above 30, pulls back while staying above 30, then breaks its bounce high. A bearish failure swing mirrors this around 70. It is judged on RSI alone, independent of price action. SK hynix had completed three of the four steps by 19 Nov 2026 but had not broken 51.8.