Golden Cross Trading Strategy: Rules to Filter Fakes
A golden cross trading strategy tested on 10 years of Samsung and SK hynix data: 43% of 5/20-day crosses reversed in 10 days. Volume, disparity and stop rules.
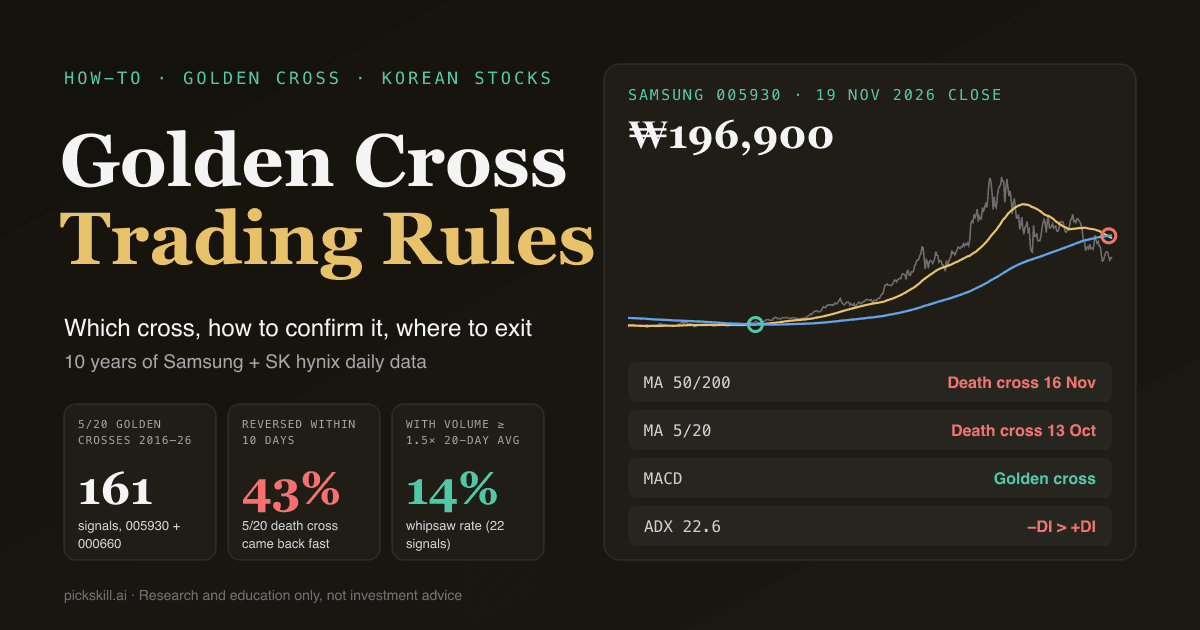
A golden cross trading strategy treats a short moving average crossing above a long one as a candidate entry only, then requires confirmation (volume, disparity, the weekly chart) and a stop level fixed before the trade. The cross alone is not enough: across 10 years of daily data on Samsung Electronics and SK hynix, 43% of 161 five-day-over-20-day golden crosses were reversed by a death cross within 10 trading days (Yahoo Finance data, PickSkill calculation, Nov 2016 – Nov 2026).
If you need the definition first, read Golden Cross vs Death Cross: The 50/200-Day MA Signal. This post is the practical follow-up: which cross to trade, what to check on the day it happens, where to put the stop, and what to do when the death cross arrives. Korean traders search this as 골든크로스 매매법, so the worked examples use KOSPI heavyweights. All readings are as of the 19 Nov 2026 close.
Key takeaways
- "Golden cross" means four different signals. 5/20-day, 20/60-day, 50/200-day and MACD crosses differ hugely in frequency. Samsung printed 80 golden crosses on the 5/20 pair in 10 years and 5 on the 50/200 pair.
- An unfiltered 5/20 cross had no edge. 54% of the 161 signals were higher 20 trading days later, against 56% for any random day in the same data.
- Volume cut whipsaws the most. When volume on the cross day was at least 1.5× its 20-day average, the 10-day reversal rate fell from 43% to 14% (22 signals, a small sample).
- Use the cross-day low as the first stop. 61 of the 69 crosses that reversed (88%) had already closed below the cross-day low before the death cross printed.
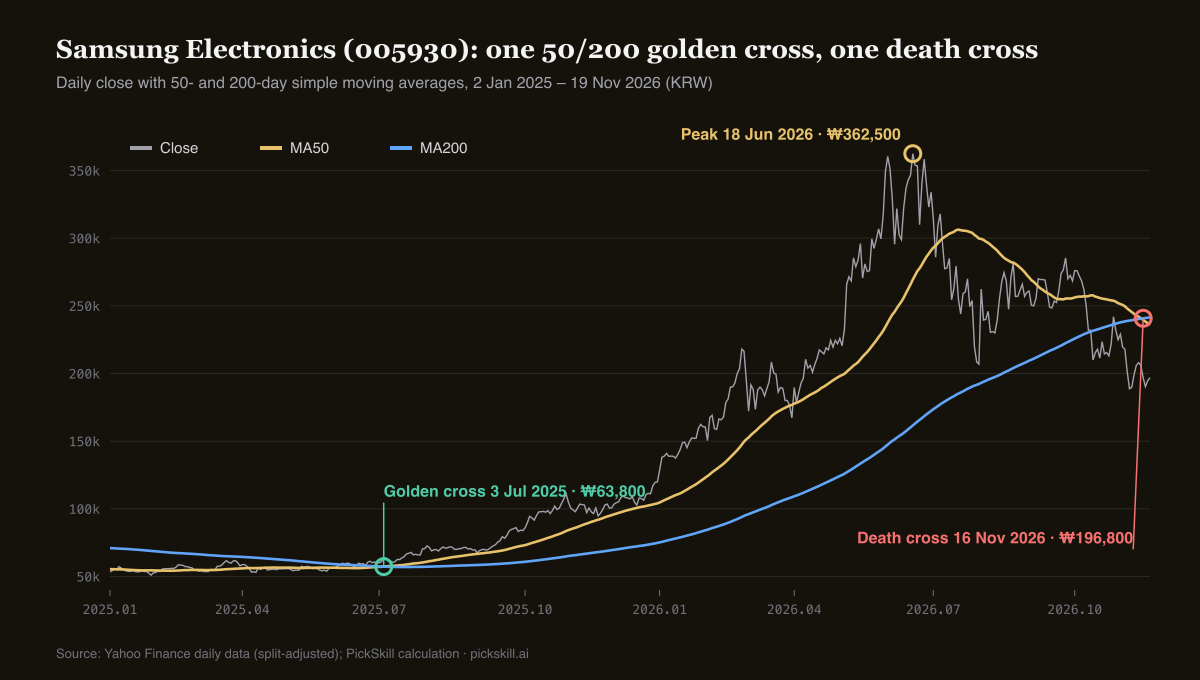
- Death crosses arrive late. Samsung's 50/200 death cross on 16 Nov 2026 came about five months after its 18 Jun peak of ₩362,500, and 46% below it.
Which golden cross do people actually mean?
There are four common versions. Korean brokerage charts default to the 5-day and 20-day moving averages, so a "golden cross" there usually means the 5/20 pair. Swing traders and sell-side notes often use 20/60. US-style long-term analysis uses 50/200. And many traders say "golden cross" when the MACD line crosses above its signal line. Shorter pairs fire often and react fast, but produce more false signals; longer pairs are rare and late, but mark big trend changes. Pick one before you write any rules. The counts below are our own, from Yahoo Finance daily closes between 21 Nov 2016 and 19 Nov 2026.
| Cross | Typical use | Samsung golden crosses (10 yrs) | SK hynix golden crosses (10 yrs) | Character |
|---|---|---|---|---|
| 5/20-day | Korean HTS default, short-term | 80 | 82 | Fast, many whipsaws |
| 20/60-day | Swing / medium-term | 20 | 16 | One-to-three-month trend |
| 50/200-day | Global standard, long-term | 5 (latest 3 Jul 2025) | 6 (latest 19 Feb 2025) | Rare and late |
| MACD (12,26,9) | Momentum turn | Fired 19 Nov 2026 | — | Below zero = early bounce |
Different crosses can disagree on the same day. On 19 Nov 2026, the PickSkill Samsung page showed MACD as "Bullish · golden cross", three trading days after the 50-day average fell below the 200-day. A MACD cross below the zero line says the decline is slowing, not that the long-term trend has turned. For that signal specifically, see How to Confirm a MACD Golden Cross.
How reliable is a golden cross, really?
Unfiltered, the 5/20-day golden cross was barely better than chance in our test. We took every 5/20 golden cross on Samsung and SK hynix with at least 20 trading days of follow-through, 161 in total. Twenty trading days later, 54% were above the cross-day close, with an average return of +2.8%. Buying on any random day in the same decade gave 56% and +2.9%. The bigger problem is speed: 69 of the 161 crosses (43%) were cancelled by a 5/20 death cross within 10 trading days. That matches what StockCharts ChartSchool says about crossover systems: signals are late, and without a strong trend they produce many whipsaws.
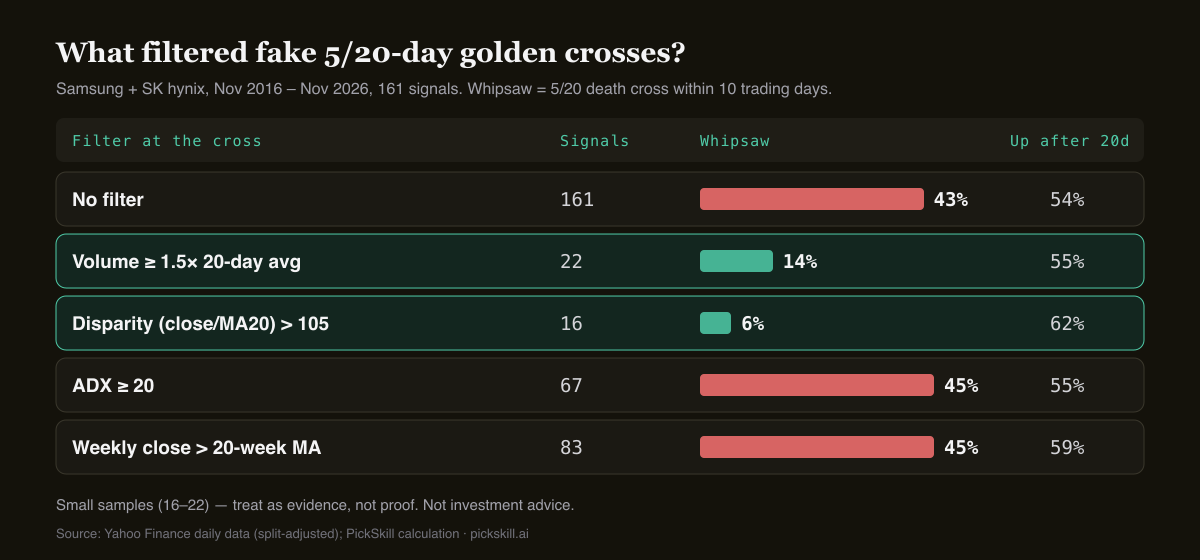
Filters changed the picture, though not all of them. The 22 crosses with volume of at least 1.5× the 20-day average had a 14% whipsaw rate. The 16 decisive breakouts where the close sat more than 5% above the 20-day average (disparity above 105) whipsawed only 6% of the time and averaged +10.8% after 20 days. ADX ≥ 20 did not help (45% whipsaw). The weekly filter left whipsaws unchanged but lifted the 20-day hit rate to 59% and the average return to +5.0%. With samples of 16 to 22 signals, treat this as evidence for a direction, not a law.
What should you check before acting on a golden cross?
On the day of the cross, the question is not whether it happened but how forcefully. Combining the data above with standard practice, these six checks work in order: the first three filter fakes, the last three size up the trend. Every value is visible on a standard chart or on the PickSkill indicators page.
- Fix the cross and the holding period. A 5/20 signal is a trade of weeks; a 50/200 signal is a trade of months. Mixing them breaks the rules.
- Require volume of at least 1.5× the 20-day average. This was the most effective filter in our data. Quiet crosses are often two converging averages wobbling past each other.
- Check disparity on the cross day. A close 5% or more above the 20-day average means price dragged the average up. But a reading of 130–140 is chasing: SK hynix hit 144.1 on 11 May 2026, six weeks before its peak and the steep correction that followed.
- Check ADX for a trend. Below 15 is a range, where crosses flip constantly. Samsung's 22 Sep 2026 5/20 golden cross came with ADX at 9.4 and reversed on 13 Oct. Since ADX ≥ 20 did not reduce whipsaws in our sample, use it as context, not as a hard filter. Background: What Is ADX?
- Look at the weekly chart. If last week's close was above the 20-week average, the daily cross agrees with the bigger trend. In our data that raised the average 20-day return from +2.8% to +5.0%.
- Watch whether it holds for several days. A cross that survives three to five sessions beats a one-day cross. SK hynix's 2 Nov 2026 5/20 golden cross lasted four sessions before the 6 Nov death cross.
Where should the stop-loss go?
Set the stop as a number before entry. The simplest rule with data behind it is the cross-day low. Of the 161 5/20 golden crosses, 95 (59%) closed below the cross-day low within five sessions. That stop triggers often, but it caught 61 of the 69 eventual whipsaws (88%) before the death cross did. The 66 crosses that held the cross-day low for five sessions were higher 20 days later 67% of the time, so holding that low works as a second confirmation. For volatile names, add ATR: on 19 Nov 2026 the 14-day ATR was ₩12,475 for Samsung (6.3% of price) and ₩105,000 for SK hynix (8.9%), which puts a 2-ATR stop about 12.7% and 17.8% below the close. Position sizing with ATR is covered in What Is ATR?
Slow crosses need slow stops. With the 50/200 pair, common exits are several closes below the 200-day average, or the opposite death cross. Whichever you pick, decide before entering and do not move it. Placing it just beyond a real support level helps avoid being shaken out by noise.
How should you respond to a death cross?
Treat a death cross as confirmation of a decline that has already happened, and use it to adjust exposure by your own rules rather than as a panic signal. Samsung shows why. Its 50-day average crossed above the 200-day on 3 Jul 2025 at a close of ₩63,800, on volume 1.63× the 20-day average. The stock reached ₩362,500 on 18 Jun 2026. The 50/200 death cross came about five months later, on 16 Nov 2026 at ₩196,800: 46% below the peak, yet still 208% above the golden-cross close. Long-term crosses miss tops and bottoms, but they can carry you through the middle of a big trend.
SK hynix followed the same arc: a 50/200 golden cross on 19 Feb 2025 at ₩218,500, a peak of ₩2,919,000 on 22 Jun 2026, and a death cross on 17 Nov 2026 at ₩1,098,000. The KOSPI index crossed earlier, on 3 Nov; the index-level picture is in KOSPI Technical Analysis. After a death cross, check three things: whether the 200-day average has started to slope down, whether the decline came on heavy volume, and whether the next short-term 5/20 golden cross happens below the 200-day line. A short-term cross below a falling 200-day is more likely a bounce inside a downtrend.
Where do Samsung and SK hynix stand now?
As of the 19 Nov 2026 close, both stocks have their long averages stacked bearishly, with only some short-term momentum gauges trying to turn. Values come from the PickSkill stock pages for Samsung and SK hynix, plus our own calculations from Yahoo Finance daily data.
| Reading (19 Nov 2026 close) | Samsung 005930 | SK hynix 000660 |
|---|---|---|
| Close | ₩196,900 | ₩1,183,000 |
| MA 5 / 20 / 60 | 196,940 / 209,685 / 239,670 | 1,152,200 / 1,281,300 / 1,531,033 |
| Latest 50/200 cross | Death cross, 16 Nov 2026 | Death cross, 17 Nov 2026 |
| Latest 5/20 cross | Death cross, 13 Oct 2026 | Death cross, 6 Nov 2026 |
| 20-day disparity | 93.9 | 92.3 |
| RSI(14) | 40.1 (neutral) | 41.4 (neutral) |
| ADX / DMI(14) | 22.6, −DI 29.4 > +DI 19.8 | 24.7, −DI 31.5 > +DI 18.9 |
| MACD | Bullish · golden cross | Neutral |
| Volume vs 20-day avg | 0.78× | 0.76× |
Run through the checklist and neither stock is a golden-cross candidate yet: volume is below average and the 50-day average now sits under the 200-day. If the next 5/20 golden cross prints, the first checks are 1.5× volume and whether the cross-day low holds. How RSI behaves in the 40s here is covered in How to Read RSI, using SK hynix.
How can you track golden crosses in PickSkill?
PickSkill's stock pages refresh eight indicators after each close (MACD, moving averages, RSI(14), KDJ, Bollinger Bands, ADX/DMI, volume and money flow) and show a five-day signal trail for each. That trail makes check 6 easy: you can see whether a cross flipped after one day or has held for a week. Korean and Japanese stocks were added in November 2026 for stock pages and the AI Panel. To watch several holdings at once, portfolio indicators shows all eight signals per position. For US, Hong Kong and China A-share stocks, the signal screener finds fresh 5/20 golden crosses directly; see How to Screen Stocks for a Golden Cross.
This article is for research and education only, not investment advice. Historical statistics do not guarantee future results.
FAQ
Which moving averages are best for a golden cross strategy? It depends on your holding period. The 5/20-day pair suits trades of a few weeks and is the default on Korean charts; 20/60 fits swing trades; 50/200 is the standard long-term trend signal. Shorter pairs give more and earlier signals but far more fakes: Samsung had 80 golden crosses on 5/20 versus 5 on 50/200 in ten years. Choose one pair and use it consistently.
How often does a golden cross fail? In our test on Samsung and SK hynix from 2016 to 2026, 43% of 161 five-day-over-20-day golden crosses were reversed by a death cross within 10 trading days. Only 54% were higher 20 days later, similar to the 56% for a random day. Crosses with volume at least 1.5× the 20-day average reversed 14% of the time, but that is only 22 signals.
Where do you put a stop-loss after a golden cross? For short-term crosses, the cross-day low is the simplest level. In our data, 88% of the crosses that later reversed had already closed below that low before the death cross. Volatile stocks often use 1.5 to 2 times ATR instead. For 50/200 crosses, traders typically reduce exposure on several closes below the 200-day average or on the death cross.
Should you sell when a death cross appears? A death cross confirms a decline that is already under way, so it is late by design. Samsung's 16 Nov 2026 50/200 death cross came five months after the peak and 46% below it. Use it to apply rules you set in advance, and check the 200-day slope, volume, and whether rebounds stall below the 200-day average.
What is the difference between a MACD golden cross and a moving average golden cross? A moving average golden cross compares two price averages and signals a trend change. A MACD golden cross is the MACD line crossing its signal line, which reflects momentum and turns earlier. They can disagree: on 19 Nov 2026 Samsung showed a MACD golden cross three days after a 50/200 death cross.