P/E vs EV/EBITDA: Which Is Better? A Worked Example
P/E vs EV/EBITDA: formulas, what each ignores, when each misleads, and both multiples worked out for Microsoft and Oracle from their latest 10-Ks.
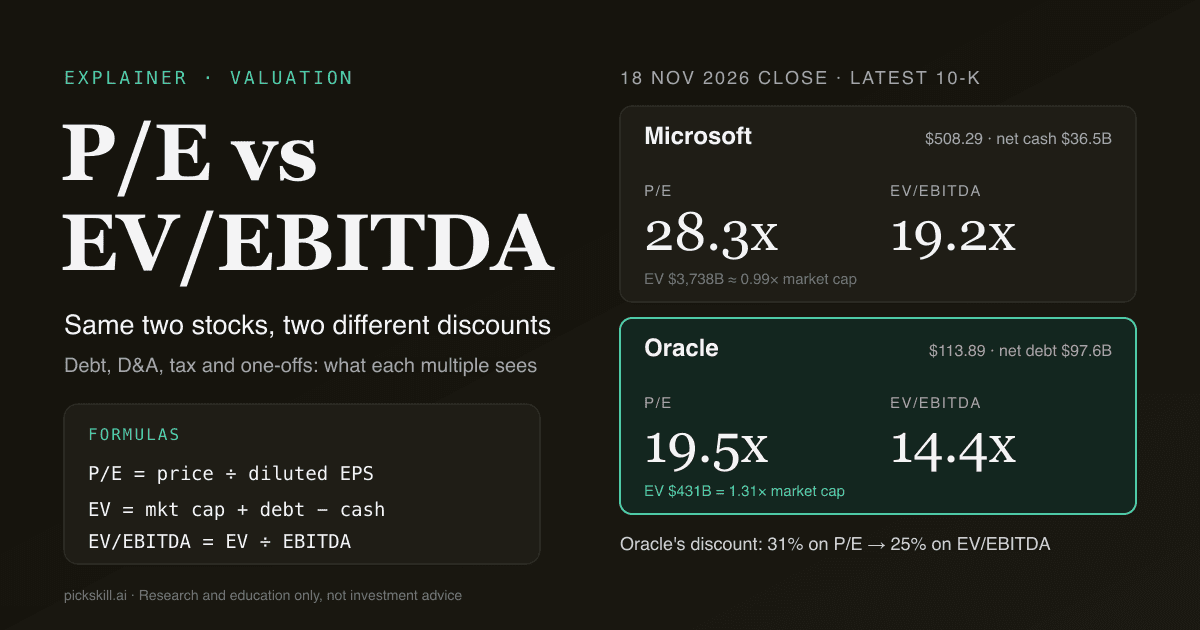
Neither multiple is better in general: P/E prices a company's equity against its net profit, while EV/EBITDA prices the whole business, debt included, against operating profit before depreciation and amortization, so EV/EBITDA is the fairer tool for comparing companies with different debt loads and P/E is the more direct measure of what a shareholder pays per dollar of earnings. EV/EBITDA is enterprise value (market cap plus net debt) divided by earnings before interest, taxes, depreciation and amortization. At the 18 Nov 2026 close, Oracle traded at 19.5x its fiscal 2026 diluted EPS against Microsoft's 28.3x, a 31% discount, but on EV/EBITDA the gap shrank to 25% (14.4x vs 19.2x), because Oracle's $97.6 billion of net debt, from its 10-K filed with the SEC on 22 June 2026, lifts its enterprise value to 1.31x its market cap.
That gap between the two answers is the whole point of using both. Each multiple hides something the other shows, and the worked example below walks through exactly what.
Key takeaways
- Different numerators: P/E uses the share price (equity only); EV/EBITDA uses enterprise value, which adds debt and preferred stock and subtracts cash.
- Different denominators: P/E uses net income after interest, tax and depreciation; EBITDA stops before all three.
- Debt is the big divider: on 18 Nov 2026 Microsoft had $36.5B more cash than debt, Oracle $97.6B more debt than cash, so Oracle's P/E discount overstated how cheap the business was.
- EBITDA flatters capex-heavy firms: Oracle spent $55.7B on capex in fiscal 2026, 186% of its $29.9B EBITDA, and its free cash flow was negative $23.7B.
- P/E is distorted by one-offs and tax: Microsoft's P/E includes $6.5B of OpenAI investment gains; Oracle's reflects a 12.6% effective tax rate.
- Banks and insurers: skip EV/EBITDA entirely; use P/E and price-to-book.
What is the difference between P/E and EV/EBITDA?
The difference is who the multiple prices and which profit it uses. The P/E ratio divides the share price by earnings per share, so it measures what shareholders pay for each dollar of net income, the profit left after interest, taxes, depreciation and amortization. EV/EBITDA divides enterprise value, the price of buying the whole company including its debt, by EBITDA, operating profit before depreciation and amortization. Because the numerator and denominator both cover lenders and shareholders, EV/EBITDA is "capital-structure neutral": two identical businesses with different amounts of debt should show similar EV/EBITDA but very different P/E ratios. That is why bankers and private equity buyers lean on EV/EBITDA, while most retail screeners lead with P/E.
| P/E | EV/EBITDA | |
|---|---|---|
| Formula | Share price ÷ diluted EPS (or market cap ÷ net income) | (Market cap + debt + preferred + minority interest − cash) ÷ EBITDA |
| Who it prices | Shareholders only | Shareholders and lenders (the whole business) |
| Profit measure | Net income, after interest, tax, D&A | Operating profit before D&A; before interest and tax |
| Affected by debt | Yes, strongly | Mostly neutral |
| Affected by tax rate | Yes | No |
| Affected by D&A and capex | Yes (via depreciation) | No, ignores both |
| Affected by one-off gains below operating line | Yes | No |
| Works for banks and insurers | Yes | No |
| Works for loss-making firms | No (negative P/E) | Sometimes, if EBITDA is positive |
| Typical use | Stock screens, mature profitable firms | Peer comps, M&A, leveraged and capital-intensive firms |
How do you calculate P/E and EV/EBITDA?
P/E is price per share divided by diluted earnings per share over the last four quarters or the last fiscal year; equivalently, market cap divided by net income. EV/EBITDA takes two steps. First, enterprise value: market cap, plus total borrowings, plus preferred stock and non-controlling interests, minus cash and short-term investments. Second, EBITDA: operating income plus depreciation plus amortization of intangibles, all from the income and cash-flow statements.
Small choices move the result. Data providers differ on whether lease liabilities count as debt, whether EBITDA is adjusted for stock-based compensation or restructuring, and whether figures are trailing twelve months or fiscal year. That is why two websites can quote different EV/EBITDA multiples for the same stock on the same day. Always check the definition before comparing.
Worked example: Microsoft vs Oracle
Microsoft and Oracle are both large software and cloud companies with fiscal years ending a month apart, but their balance sheets point in opposite directions. Below, both multiples use figures from each company's latest annual report on SEC EDGAR, the Microsoft 10-K for the year ended 30 June 2026 (filed 29 July 2026) and the Oracle 10-K for the year ended 31 May 2026 (filed 22 June 2026), with share counts from each 10-K cover page and prices at the 18 Nov 2026 close ($508.29 for MSFT, $113.89 for ORCL). Dollar figures are in billions.
| Step | Microsoft (FY to 30 Jun 2026) | Oracle (FY to 31 May 2026) |
|---|---|---|
| Shares outstanding | 7,425.5M | 2,880.5M |
| Market cap at 18 Nov 2026 | $3,774.3B | $328.1B |
| + Total debt | $40.3B | $129.5B |
| + Preferred stock and non-controlling interest | $0 | $5.5B |
| − Cash and short-term investments | $76.8B | $31.9B |
| = Enterprise value | $3,737.8B | $431.2B |
| Operating income | $155.2B | $20.6B |
| + Depreciation + amortization | $34.3B + $4.7B | $7.6B + $1.7B |
| = EBITDA | $194.2B | $29.9B |
| Diluted EPS (GAAP) | $17.95 | $5.83 |
| P/E | 28.3x | 19.5x |
| EV/EBITDA | 19.2x | 14.4x |
| EV/EBIT (for reference) | 24.1x | 20.9x |
| Net debt ÷ EBITDA | −0.19x (net cash) | 3.27x |
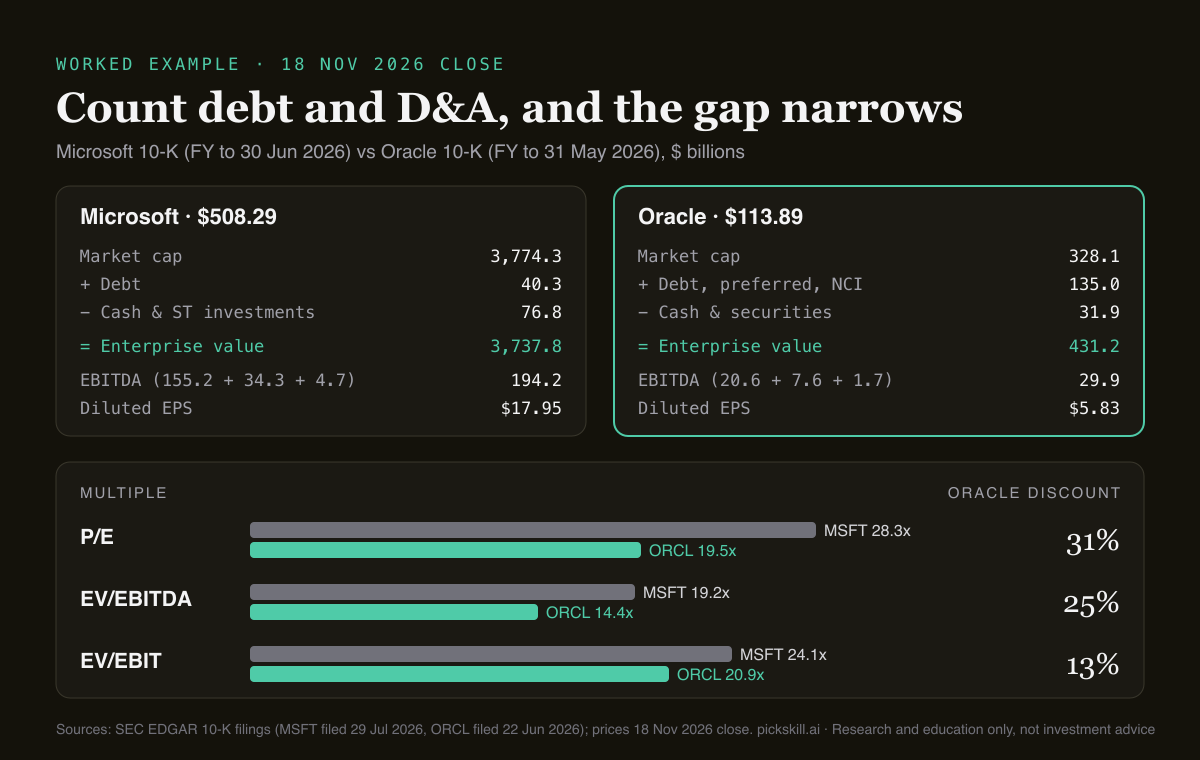
Read the three multiples in order and Oracle's discount narrows each time. On P/E it is 31% cheaper. Switch to EV/EBITDA and its $97.6B of net debt plus $4.95B of mandatory convertible preferred stock join the price, so the discount falls to 25%. Switch to EV/EBIT, which charges depreciation back, and the discount is only 13%, because Oracle's depreciation nearly doubled to $7.6B in a year (from $3.9B) as capital spending jumped from $21.2B to $55.7B. None of these numbers says either stock is cheap or expensive; they show how much of the headline gap comes from leverage and asset intensity rather than the operating business.
What does each multiple ignore?
P/E ignores the balance sheet. A company that borrows heavily can show a low P/E because the debt does not appear in the price, even though shareholders stand behind the lenders. EV/EBITDA ignores four real costs: interest, taxes, depreciation and amortization. Depreciation is the accounting echo of capital spending, so a business that must keep pouring cash into servers, fibre or factories looks better on EBITDA than its cash flow deserves.
Taxes matter more than people expect. Oracle's provision of $2.47B on $19.55B of pre-tax income is an effective rate of 12.6%; Microsoft's is 19.4% ($32.19B on $165.93B). A lower tax rate lifts net income and lowers P/E without changing EBITDA, so part of Oracle's P/E discount reflects its tax position, which can change with legislation or audits, as Oracle's own risk factors note.
When does P/E mislead?
P/E misleads most in four situations, and Microsoft and Oracle each illustrate one.
- High debt. The P/E of a leveraged company understates what you pay for the business, as Oracle's 31% vs 25% discount shows.
- One-off gains below operating income. Microsoft's fiscal 2026 net income includes $6.53B of net gains from its OpenAI investments ($4.96B after tax). Its own non-GAAP adjusted EPS of $17.28 puts the P/E at 29.4x, not 28.3x. EV/EBITDA, built on operating income, is unaffected.
- Buybacks funded by debt. Borrowing to retire shares raises EPS and can lower P/E even though the business has not changed; EV barely moves because the new debt replaces the retired equity.
- Unusual tax rates. A one-time tax benefit or a low rate cuts the P/E without any change in operations.
When does EV/EBITDA mislead?
EV/EBITDA misleads when depreciation is a real, recurring cash cost, and Oracle's latest year is a sharp example. Its capital expenditure was $55.7B against $29.9B of EBITDA and $32.0B of operating cash flow, so free cash flow was −$23.7B. Microsoft spent $115.9B on capex but generated $182.9B from operations, leaving $67.0B of free cash flow. An EBITDA multiple treats both as if none of that spending happened.
It also breaks down for banks, insurers and other lenders, because debt is their raw material, not their financing, so "enterprise value" has no clean meaning; use P/E and price-to-book there. Leases are a third trap: we left out lease liabilities ($88.5B at Microsoft, $37.9B at Oracle per the 10-Ks), and providers that include them get higher multiples. Finally, EBITDA ignores stock-based compensation, a real cost ($12.4B at Microsoft, $4.8B at Oracle in fiscal 2026).
Which should you use: P/E or EV/EBITDA?
Use both, and let the gap between them tell you where to look. A practical order:
- Start with P/E for a quick read on a profitable, low-debt company; it is what most investors quote and it reflects everything, including tax and interest.
- Switch to EV/EBITDA when debt differs across the companies you compare, or when you are comparing businesses in different tax jurisdictions.
- Add EV/EBIT or free cash flow when capex is heavy (cloud, telecoms, utilities, semis, airlines), so depreciation and real spending count.
- Use P/E and price-to-book for banks and insurers, never EV/EBITDA.
- Strip out one-offs before trusting P/E, starting with the company's own non-GAAP reconciliation in the 10-K.
- Check against intrinsic value. Multiples are relative; a DCF asks what the cash flows are worth on their own. See DCF vs comparable company analysis for how the two approaches fit.
If you want to run this comparison without building the spreadsheet, ask PickSkill's AI analyst to "compare P/E and EV/EBITDA for MSFT and ORCL and explain the gap"; it pulls the latest financials and shows its working, and you can check every figure against the filings linked above.
This article is for research and education only, not investment advice. All data as of the 18 Nov 2026 close and the fiscal-year 10-K filings cited.
FAQ
Is a lower EV/EBITDA better than a lower P/E? Neither is better on its own. A lower EV/EBITDA means you pay less for the whole business, debt included, per dollar of operating profit, so it is the fairer comparison when debt levels differ. A lower P/E means you pay less per dollar of net income, which matters to shareholders but can be flattered by debt, low tax rates or one-off gains.
Why is EV/EBITDA usually lower than P/E? EBITDA is larger than net income because it is measured before interest, tax, depreciation and amortization, so the denominator is bigger. For a company with little debt, EV and market cap are close, so EV/EBITDA comes out lower. At the 18 Nov 2026 close Microsoft was 19.2x EV/EBITDA versus 28.3x P/E.
What is a good EV/EBITDA ratio? There is no universal good number; it depends on growth, margins, capital intensity and interest rates. Compare a company with its own history and with close peers using the same definitions. A multiple well below peers can signal value, higher debt, heavier capex or weaker growth, so look at why before deciding it is cheap.
Why don't you use EV/EBITDA for banks? For banks, deposits and borrowings are the raw material of the business, not just financing, so enterprise value and EBITDA have no clean meaning. Interest is the bank's main revenue and cost. Analysts value banks with P/E, price-to-book and return on equity instead.
What is the difference between P/E and EV/EBIT? EV/EBIT uses enterprise value like EV/EBITDA but charges depreciation and amortization against profit, so it penalises capital-intensive firms that EBITDA flatters. It still ignores interest and tax. In our example Oracle traded at 20.9x EV/EBIT and Microsoft at 24.1x, a 13% gap versus 31% on P/E.